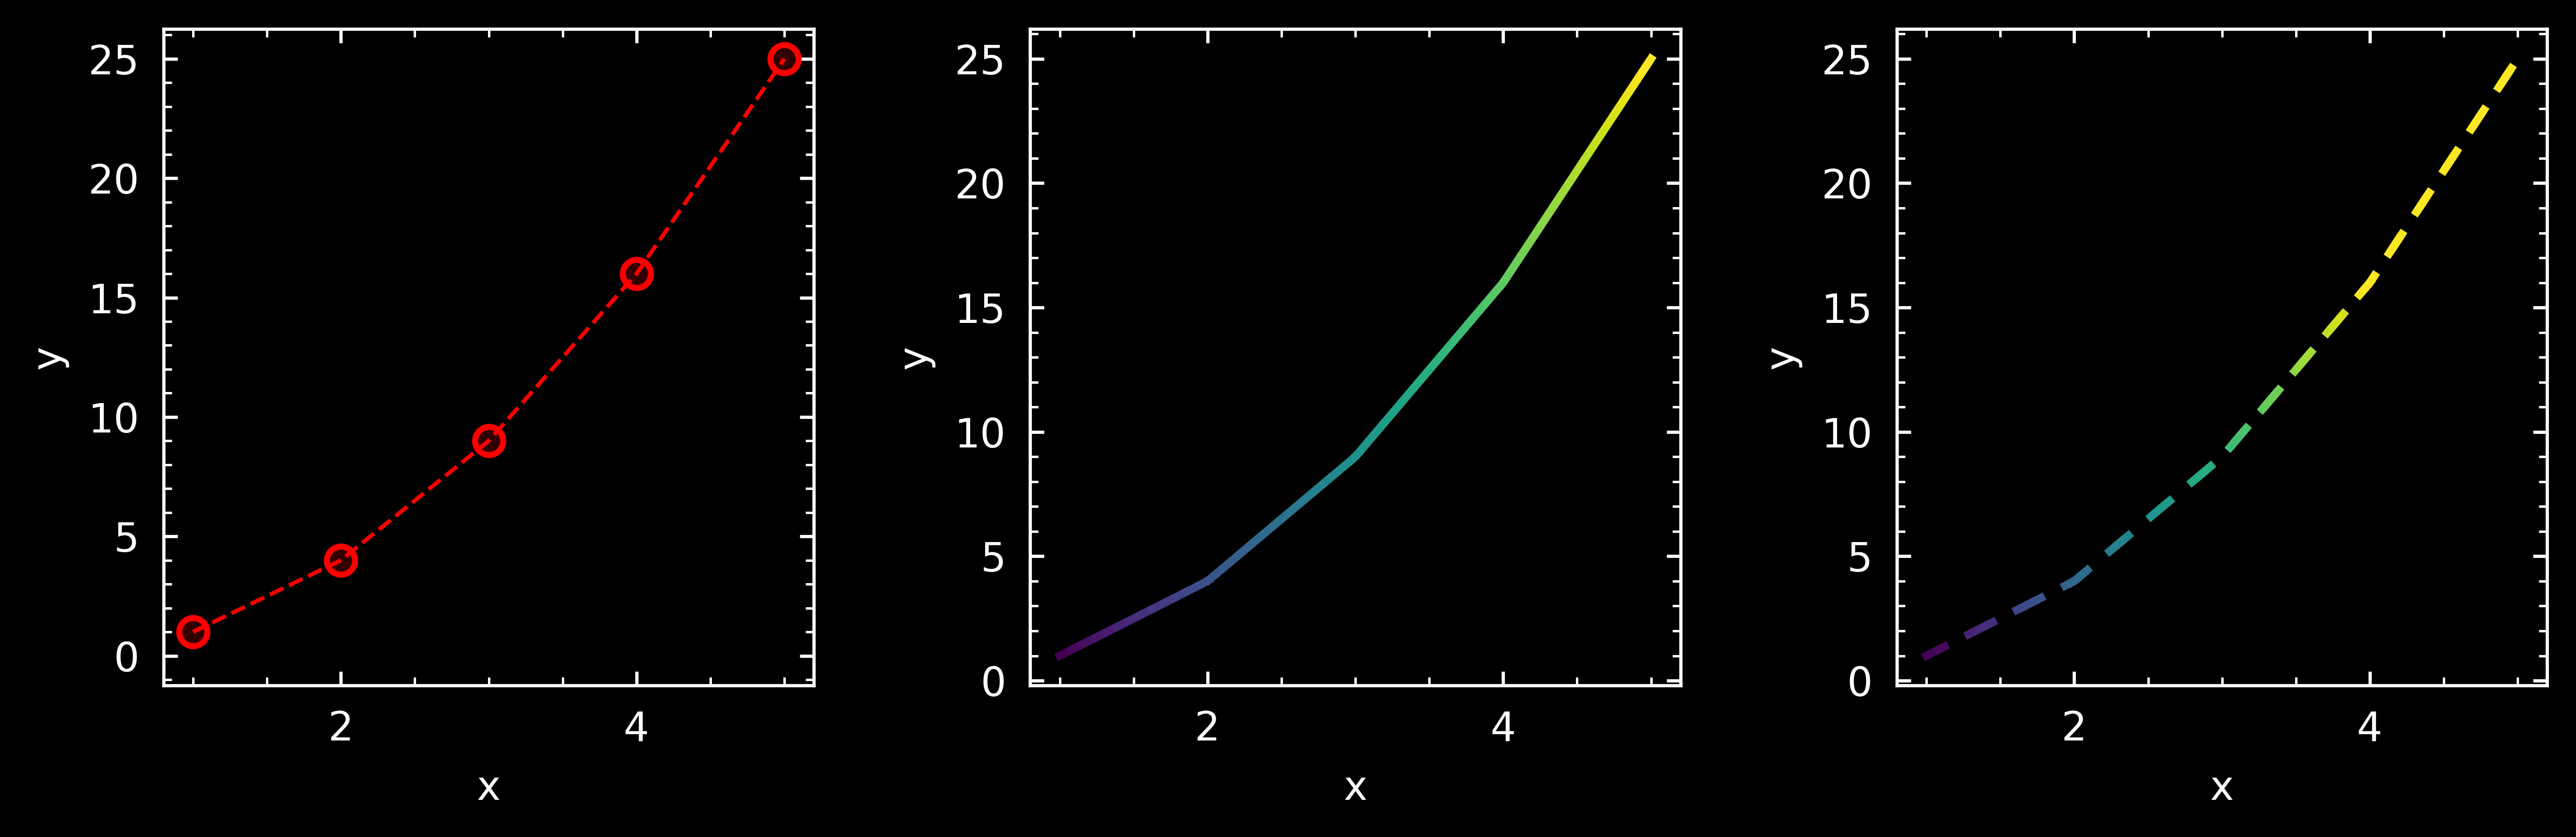
White-on-black theme#
gsplot.set_theme applies a Theme to an explicit Figure or Axes. It does
not mutate Matplotlib’s process-wide rcParams. This example sets black Figure
and Axes backgrounds with white text, spines, and ticks.
import gsplot as gs

fig, axes = gs.subplots("ABC", size=(9, 3))
gs.set_theme(
    fig,
    gs.Theme(
        figure_facecolor="black",
        axes_facecolor="black",
        text_color="white",
        spine_color="white",
        tick_color="white",
    ),
)

x = [1, 2, 3, 4, 5]
y = [1, 4, 9, 16, 25]

gs.line(axes["A"], x, y, c="red")
gs.cmap_line(axes["B"], x, y, x, props={"linewidths": 2})
gs.cmap_dash(axes["C"], x, y, x, dash=(5, 5), props={"linewidths": 2})
gs.label(axes, "x", "y")
gs.savefig(fig, "graph_white", show=False, overwrite=True)