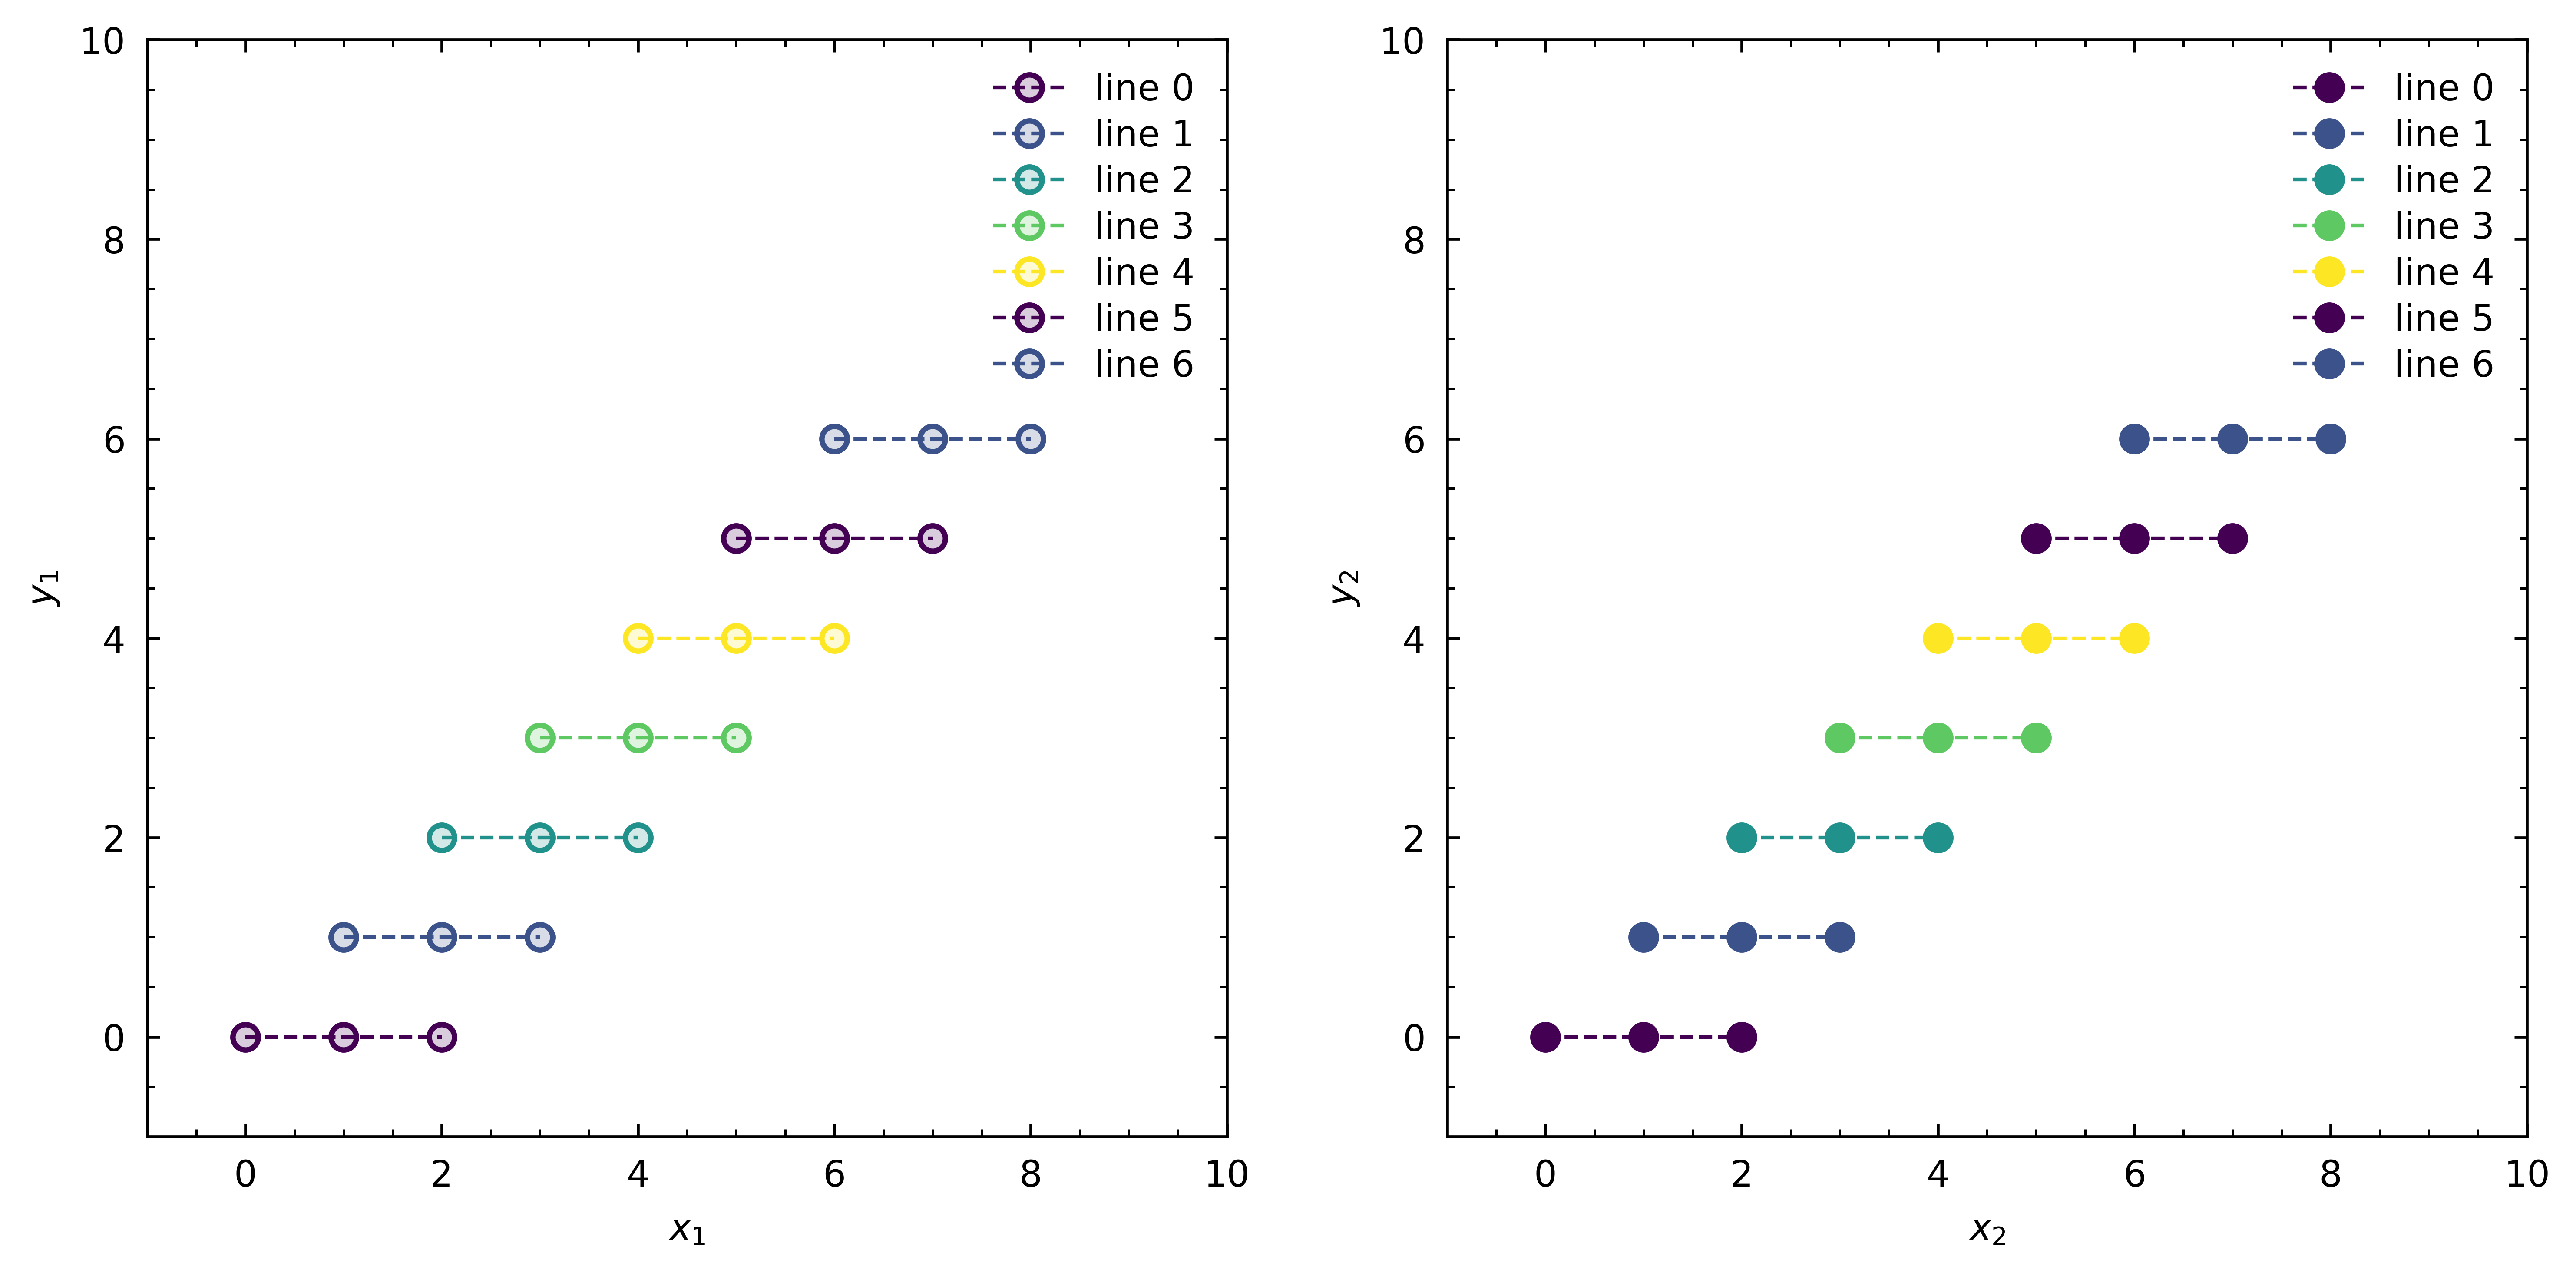
Lines, labels, and legends#
gsplot.line draws on explicit Axes. One gsplot.label call applies shared
labels, limits, square panels, and deterministic lowercase indexes, while
gsplot.legend creates publication-style local legends in target order.
import numpy as np

import gsplot as gs

x = np.linspace(0, 2 * np.pi, 41)
fig, ax = gs.subplots("AB", size=(7, 3))
gs.line(ax["A"], x, np.sin(x), label=r"$\sin(x)$")
gs.scatter(ax["B"], x[::2], np.cos(x[::2]), label=r"$\cos(x)$", s=15)
gs.label(
    ax,
    ((r"$x$", r"$\sin(x)$"), (r"$x$", r"$\cos(x)$")),
    square=True,
    index="in",
)
gs.legend(ax)
gs.save(fig, "line_and_label.png", show=False, close=True)