Colormapped lines#
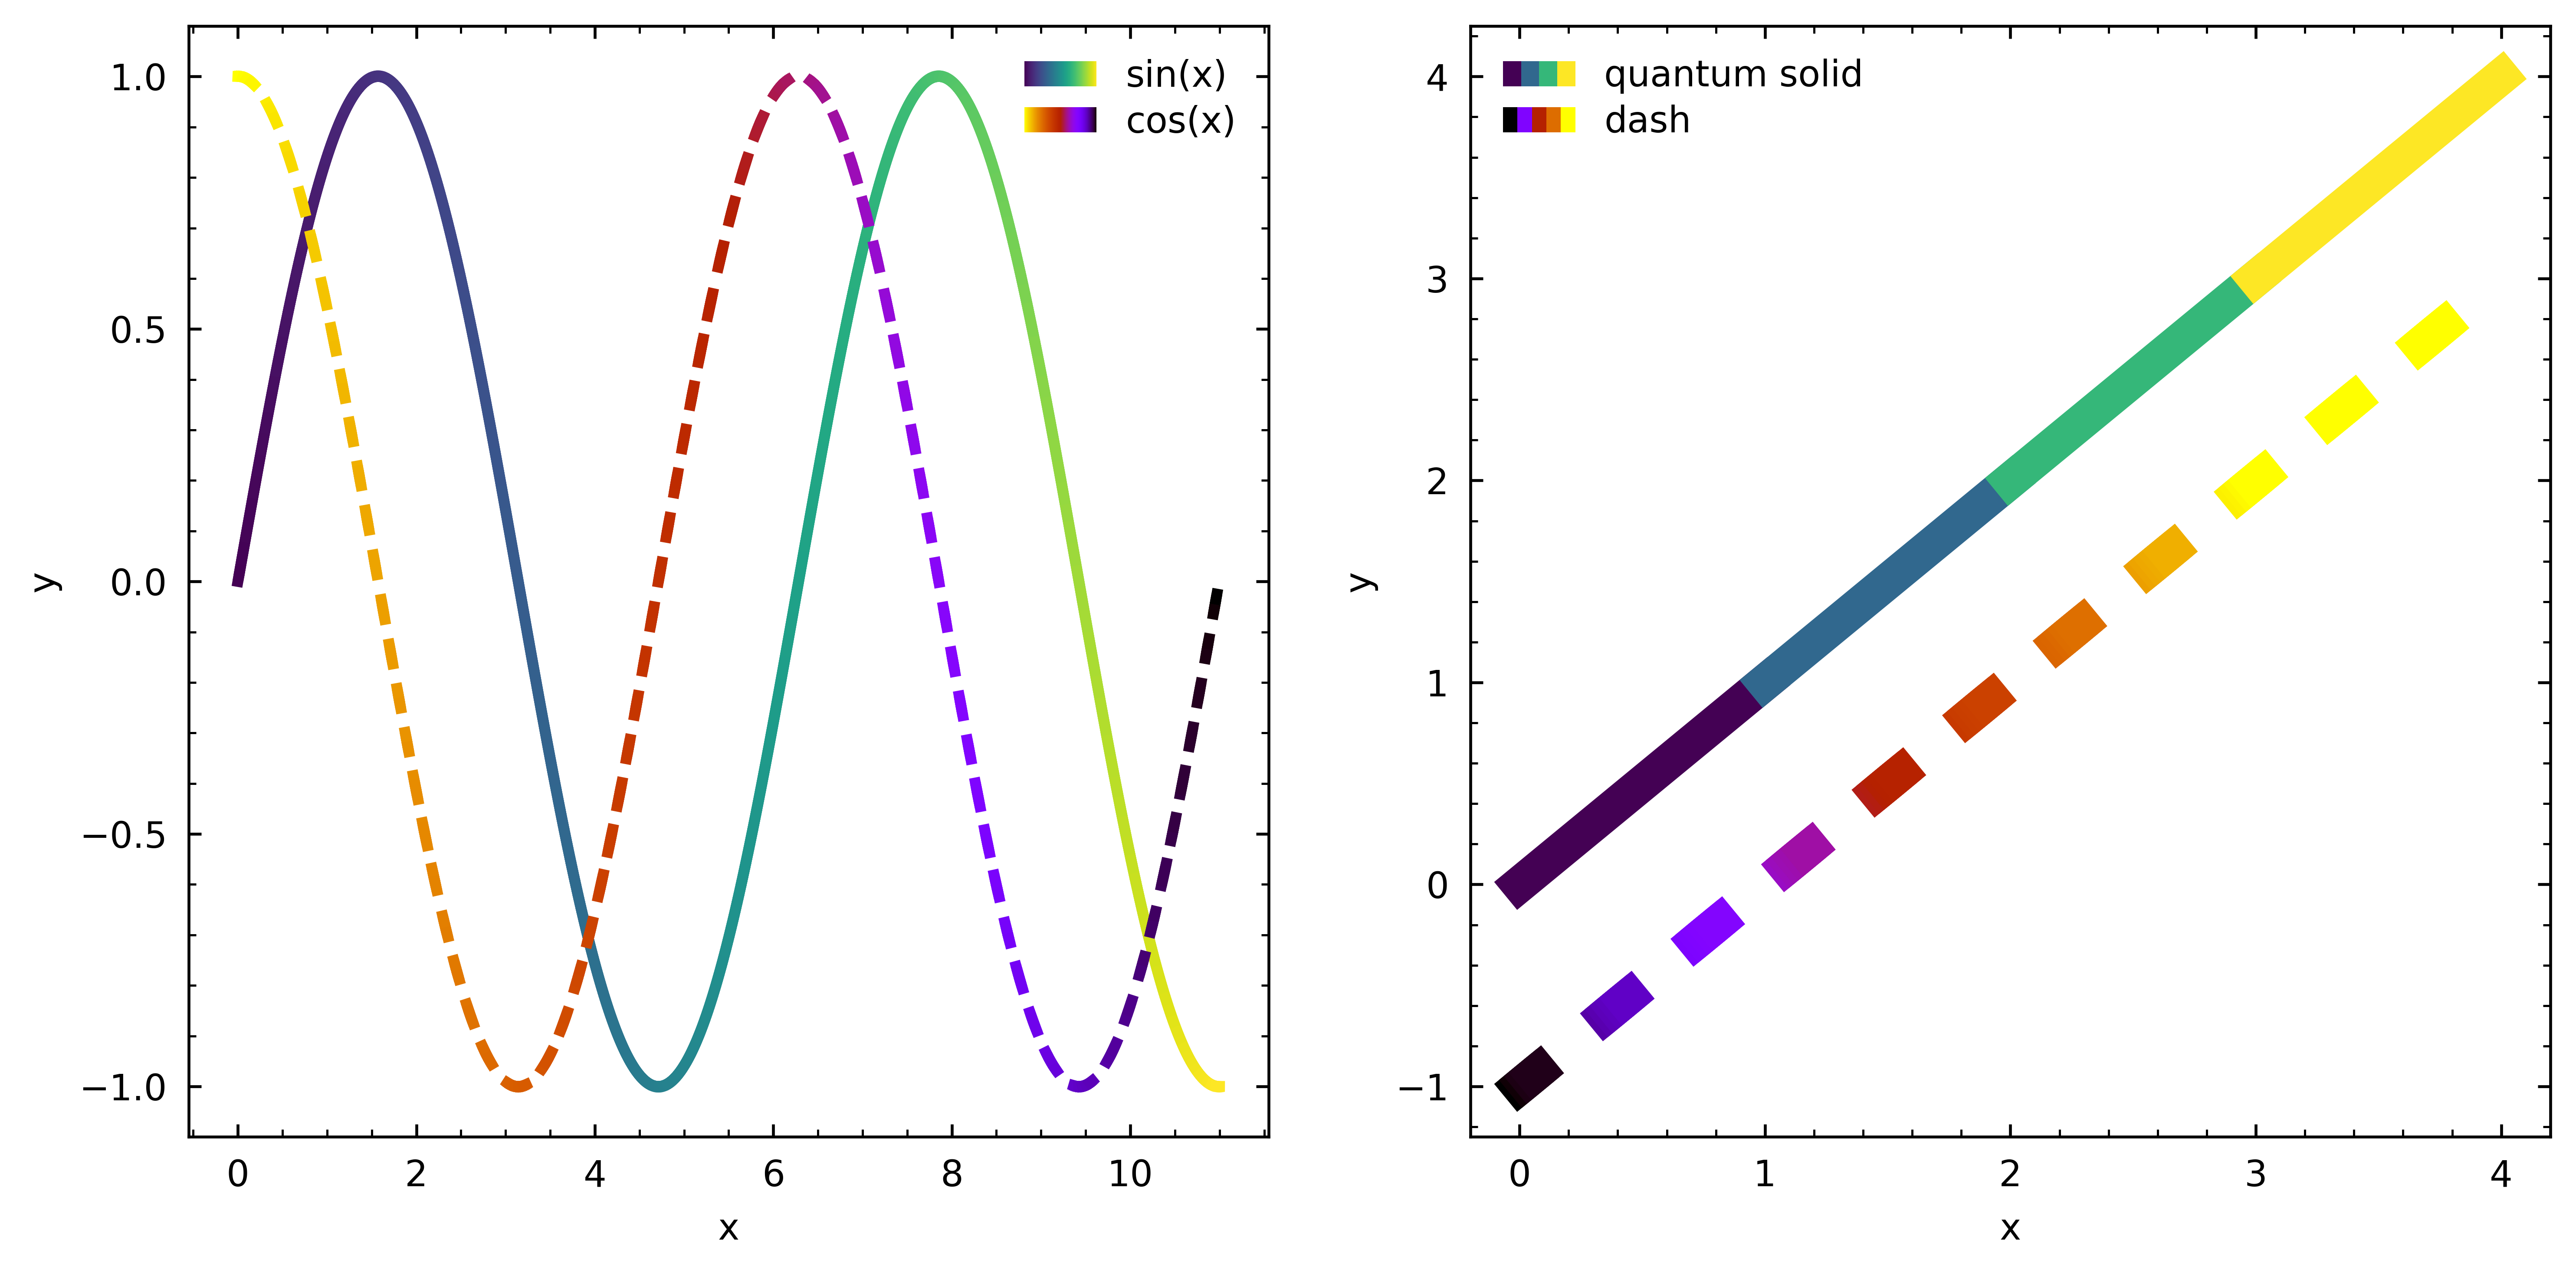
gsplot.cmap_line maps one scalar value per polyline vertex to segment
colors. gsplot.cmap_dash uses the same validation with an explicit positive
dash pattern. Repeated points are ignored as zero-length segments.
import numpy as np

import gsplot as gs

# Create data
x = np.linspace(0, 11, 1000)
u = np.sin(x)
v = np.cos(x)

n = [0, 1, 2, 3, 4]
l = [-1, 0, 1, 2, 3]
fig, axes = gs.subplots("AB", size=(10, 5))

gs.cmap_line(axes["A"], x, u, x, props={"label": "sin(x)", "linewidths": 3})
gs.cmap_dash(
    axes["A"],
    x,
    v,
    x,
    dash=(5, 5),
    cmap="gnuplot_r",
    props={"label": "cos(x)", "linewidths": 3},
)

gs.cmap_line(axes["B"], n, n, n, props={"label": "quantum solid", "linewidths": 10})
gs.cmap_dash(
    axes["B"],
    n,
    l,
    n,
    dash=(20, 40),
    cmap="gnuplot",
    props={"label": "dash", "linewidths": 10},
)

gs.legend(axes["A"])
gs.legend(axes["B"], loc="upper left")
gs.label(axes, "x", "y")
gs.savefig(fig, "line_colormap", show=False, overwrite=True)