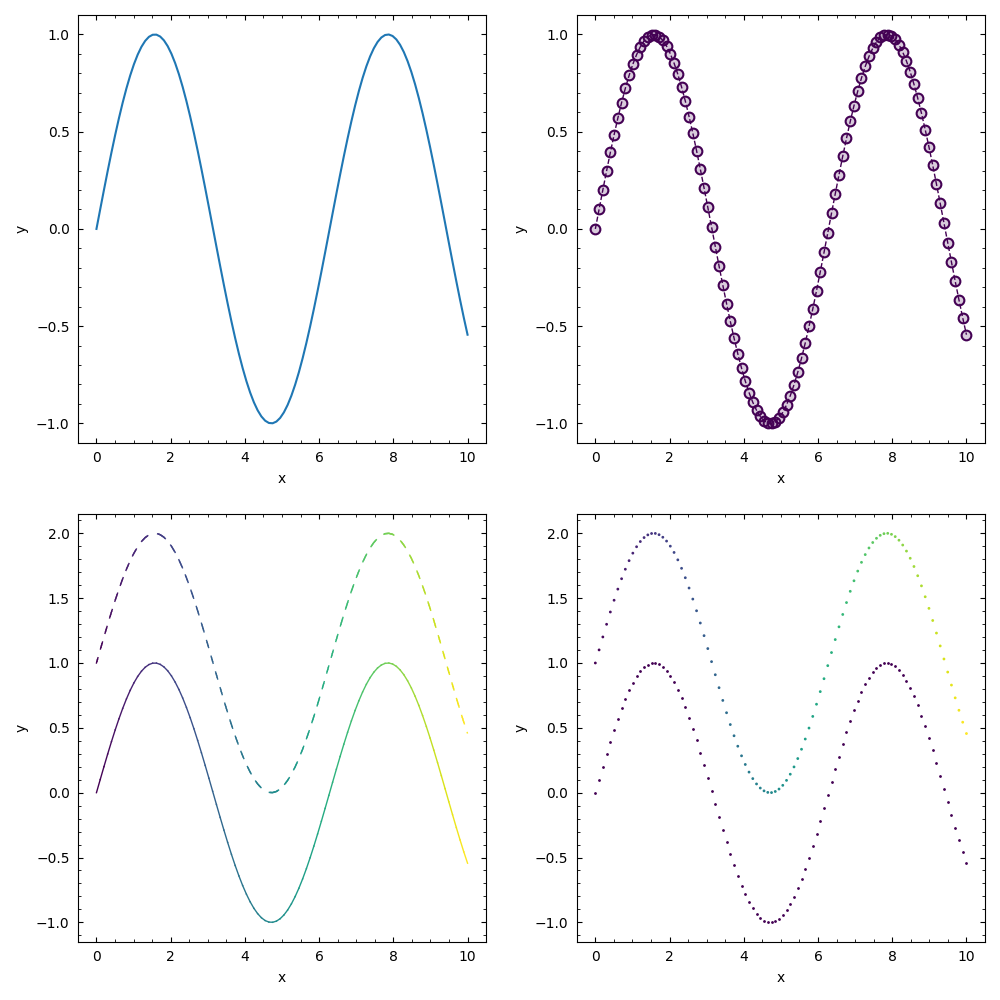
Matplotlib interoperability#
This example shows Matplotlib compatibility: axes returned by plt.subplots
can be passed directly to canonical gsplot functions.
Example#
Code#
import matplotlib.pyplot as plt
import numpy as np

import gsplot as gs

x = np.linspace(0, 10, 100)
y = np.sin(x)

# Ordinary Matplotlib figures can be passed directly to gsplot.
fig, axs = plt.subplots(2, 2, figsize=(10, 10))

axs[0, 0].plot(x, y)

# gsplot can be used to plot on the subplots
gs.line(axs[0, 1], x, y)
gs.cmap_line(axs[1, 0], x, y, x)
gs.cmap_dash(axs[1, 0], x, y + 1, x, dash=(5, 5))
gs.scatter(axs[1, 1], x, y)
gs.cmap_scatter(axs[1, 1], x, y + 1, x)

gs.label(tuple(axs.flat), "x", "y")
gs.savefig(fig, "subplots", show=False, overwrite=True)
Plot#