Legacy 0.x compatibility#
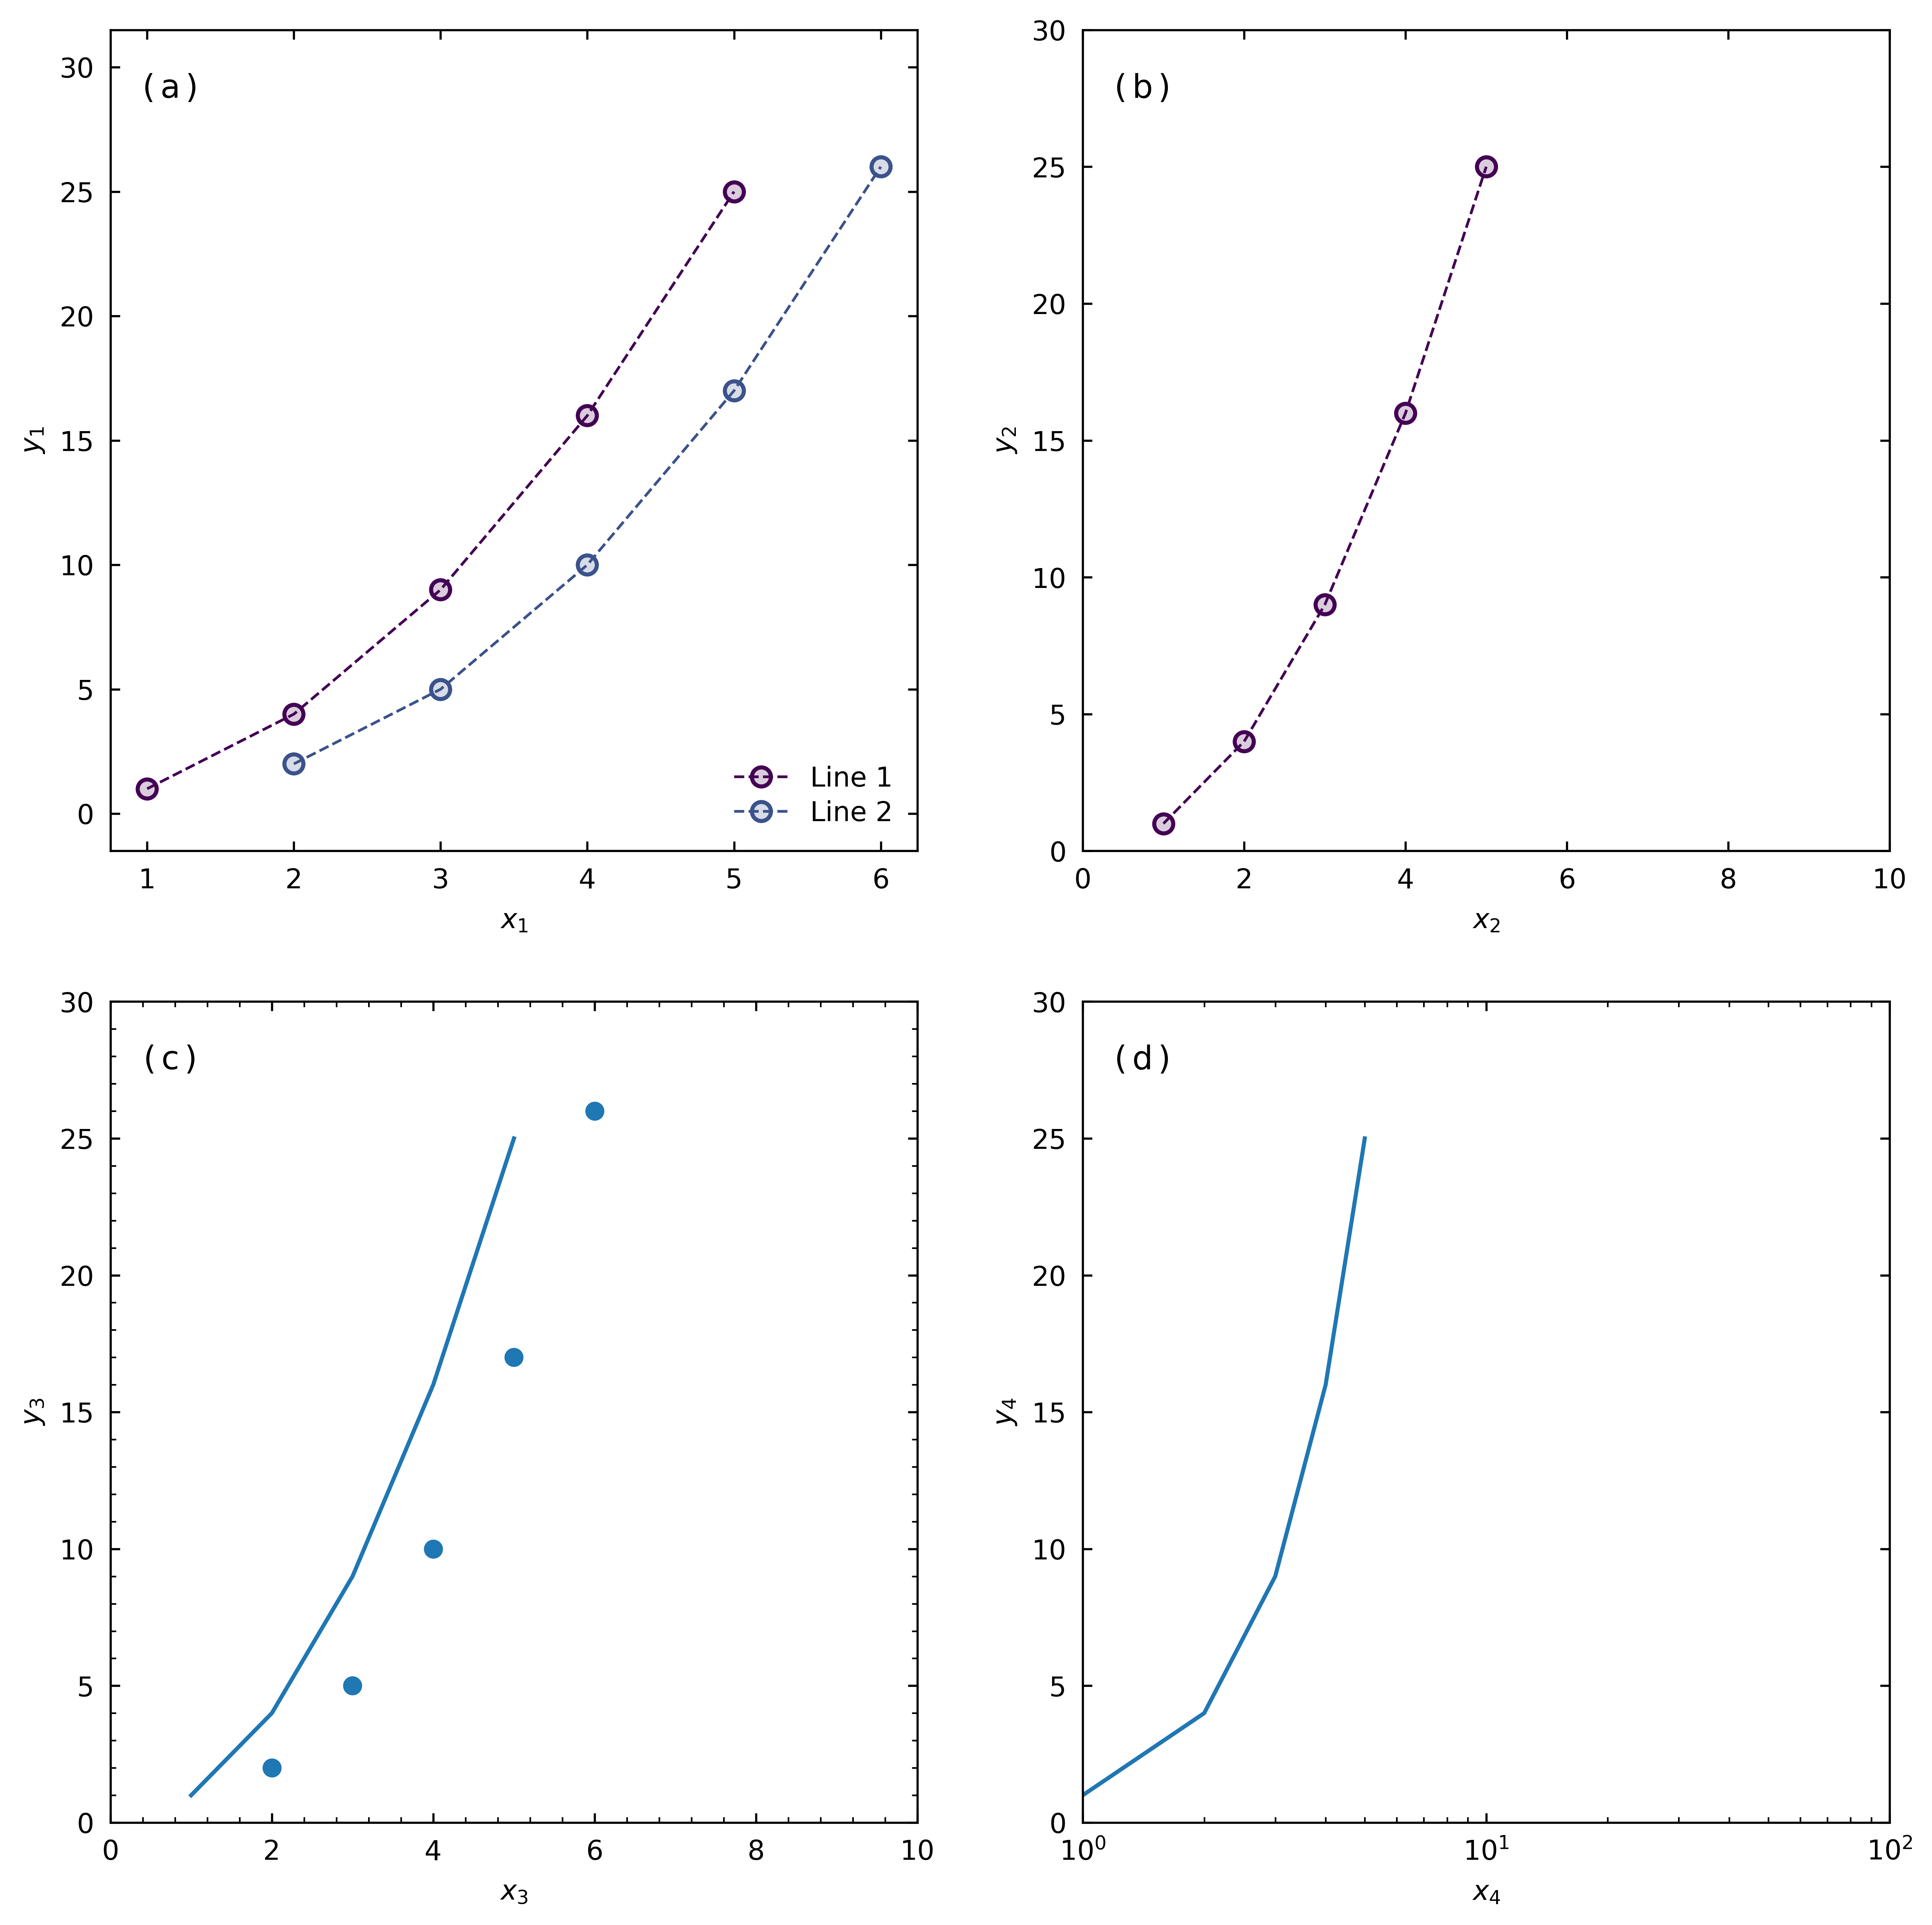
This is the one example that intentionally exercises the deprecated 0.x root surface. It is retained to validate the forwarding adapters during the 0.4.x and 1.x compatibility window. New code should use the explicit canonical API shown by the other examples.
gsplot works with ordinary Matplotlib figures and
axes. The following example mixes gsplot helpers with Axes.plot,
Axes.scatter, plt.sca, and plt.plot.
During the compatibility window, gs.axes() keeps its historical 5-by-5 inch
single-panel default, tight layout, and store flag. Option-free root
gs.line() and gs.scatter() calls keep the historical viridis automatic
color sequence. Legacy gs.show() writes its default PNG and PDF only when
the legacy store flag is enabled. New code should use gs.subplots(),
explicit props or Config values, and gs.savefig(fig, ...) instead.
Example#
Code#
import matplotlib.pyplot as plt
import numpy as np

import gsplot as gs

x = np.array([1, 2, 3, 4, 5])
y = np.array([1, 4, 9, 16, 25])

axs = gs.axes(store=True, size=(10, 10), unit="in", mosaic="AB;CD")
gs.line(axs[0], x=x, y=y, label="Line 1")
gs.line(axs[0], x=x + 1, y=y + 1, label="Line 2")
gs.line(axs[1], x=x, y=y)

# gsplot is compatible with matplotlib
# Plot data by matplotlib plot
axs[2].plot(x, y)
axs[2].scatter(x + 1, y + 1)

plt.sca(axs[3])
plt.plot(x, y)

gs.legend(axs[0], loc="lower right")
gs.label(  # type: ignore[call-overload]
    [
        # add label without specifying limits
        ["$x_1$", "$y_1$"],
        # add label with limits
        ["$x_2$", "$y_2$", [0, 10], [0, 30]],
        # add label with specifying the minor ticks
        ["$x_3$", "$y_3$", [0, 10, 5], [0, 30, 5]],
        # add label with limits and scale
        ["$x_4$", "$y_4$", [1, 100, "log"], [0, 30]],
    ],
    minor_ticks_axes=False,
)
gs.label_add_index(loc="in")
gs.show("compatibility")  # type: ignore[call-overload]
Plot#