Scatter plots#
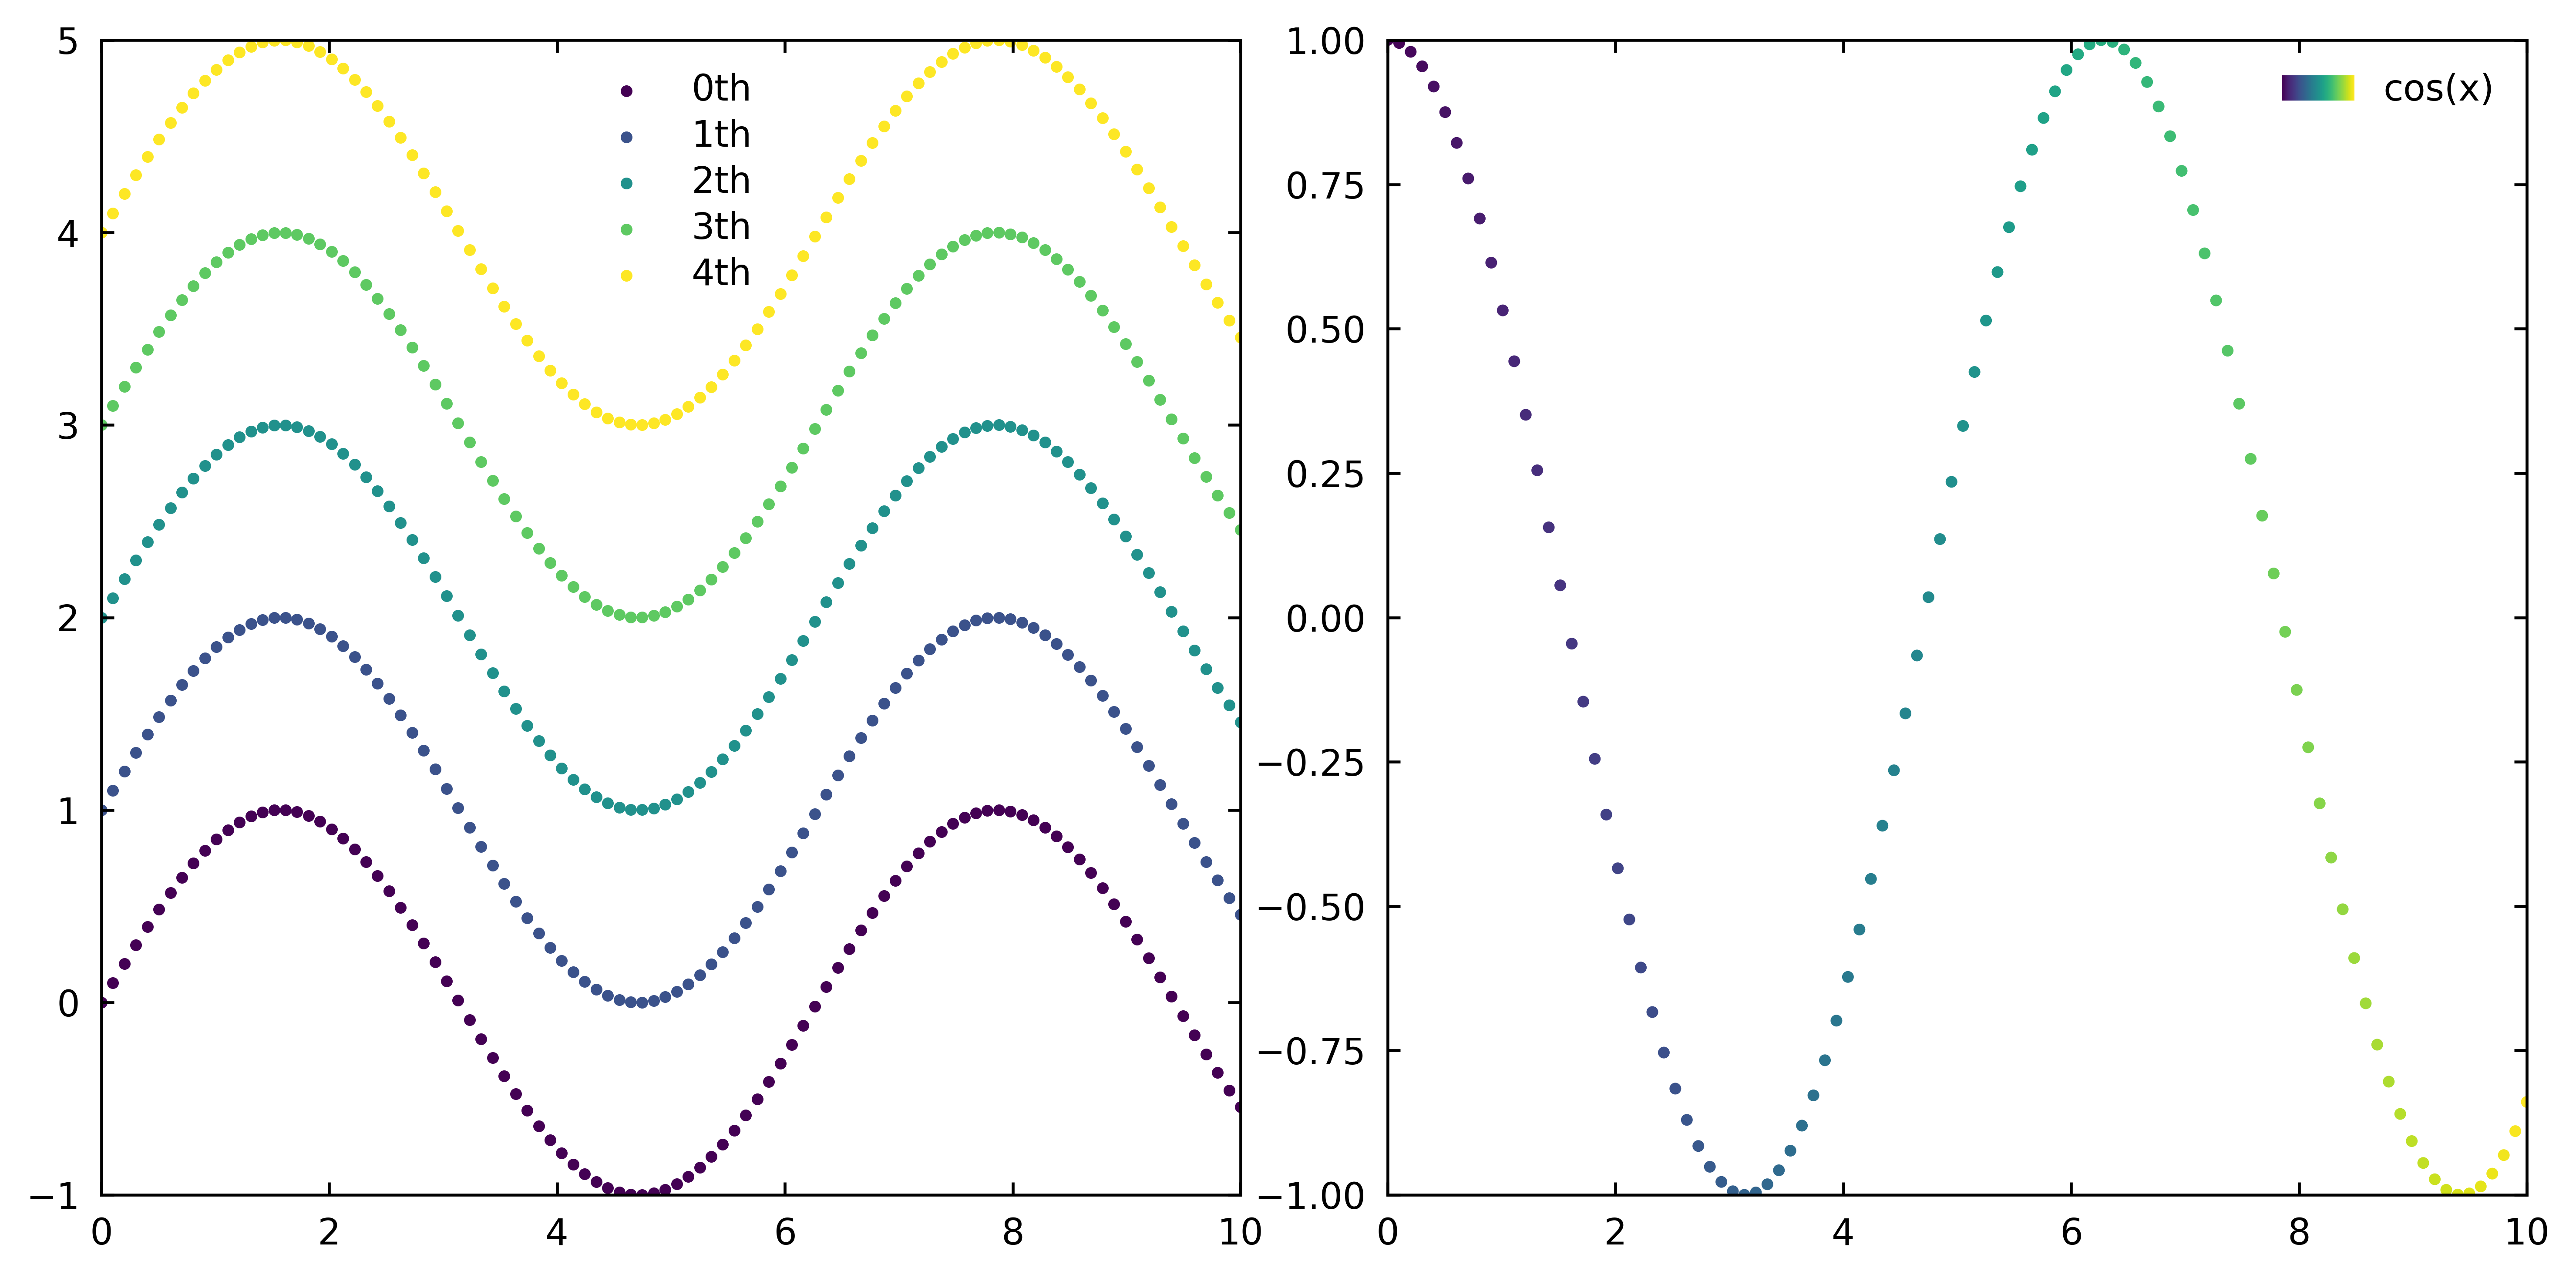
gsplot.scatter returns a native PathCollection. gsplot.cmap_scatter
adds explicit finite scalar values for colormap mapping.
import numpy as np

import gsplot as gs

fig, axes = gs.subplots("AB", size=(10, 5))

x = np.linspace(0, 10, 100)
y = np.sin(x)
for i in range(5):
    gs.scatter(axes["A"], x, y + i, label=f"{i}th", s=5)

s = np.linspace(0, 10, 100)
t = np.cos(s)
gs.cmap_scatter(axes["B"], s, t, s, props={"label": "cos(x)", "s": 5})

gs.legend(axes)
gs.label(axes, "x", "value")
gs.savefig(fig, "scatter", show=False, overwrite=True)