9. Compatibility#
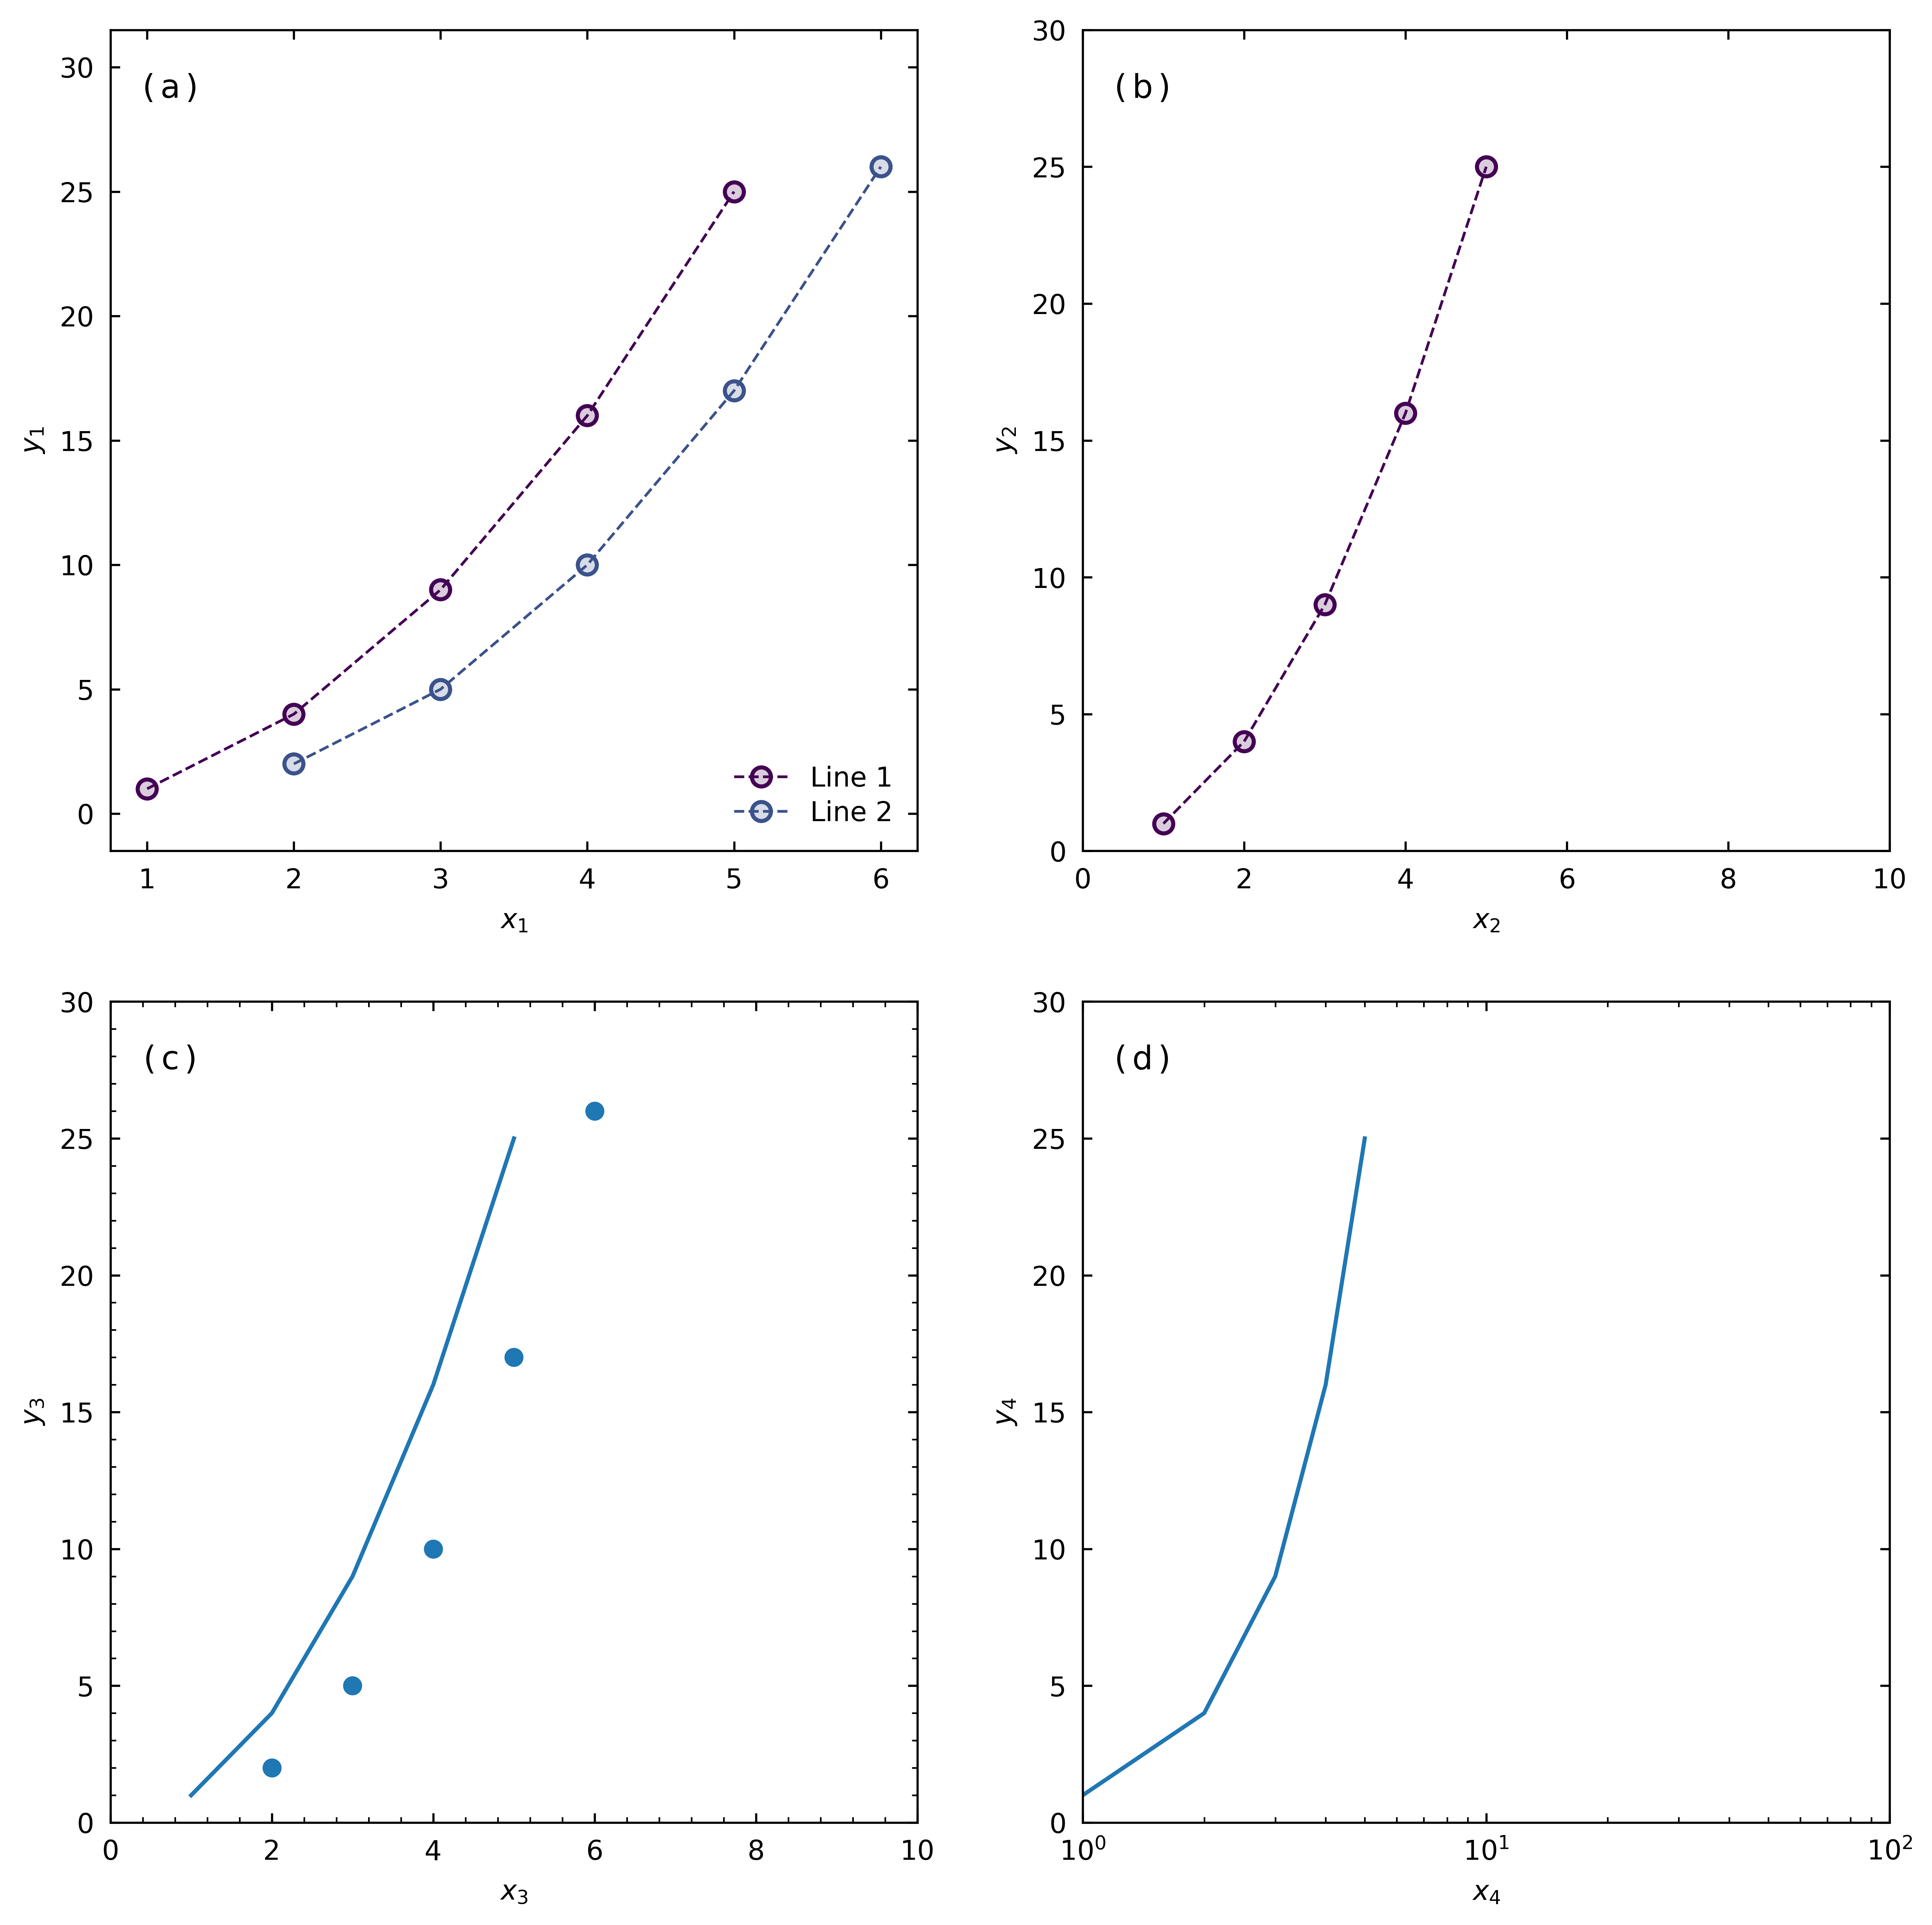
gsplot is compatible with matplotlib. This means that you can use gsplot in combination with matplotlib. In the following example, we show how to use gsplot in combination with matplotlib.
Example#
Code#
import matplotlib.pyplot as plt
import numpy as np

import gsplot as gs

x = np.array([1, 2, 3, 4, 5])
y = np.array([1, 4, 9, 16, 25])

axs = gs.axes(store=True, size=(10, 10), unit="in", mosaic="AB;CD")
gs.line(axs[0], x=x, y=y, label="Line 1")
gs.line(axs[0], x=x + 1, y=y + 1, label="Line 2")
gs.line(axs[1], x=x, y=y)

# gsplot is compatible with matplotlib
# Plot data by matplotlib plot
axs[2].plot(x, y)
axs[2].scatter(x + 1, y + 1)

plt.sca(axs[3])
plt.plot(x, y)

gs.legend(axs[0], loc="lower right")
gs.label(
    [
        # add label without specifying limits
        ["$x_1$", "$y_1$"],
        # add label with limits
        ["$x_2$", "$y_2$", [0, 10], [0, 30]],
        # add label with specifying the minor ticks
        ["$x_3$", "$y_3$", [0, 10, 5], [0, 30, 5]],
        # add label with limits and scale
        ["$x_4$", "$y_4$", [1, 100, "log"], [0, 30]],
    ],
    minor_ticks_axes=False,
)
gs.label_add_index(loc="in")
gs.show("compatibility")
Plot#
