2. Line and Label#
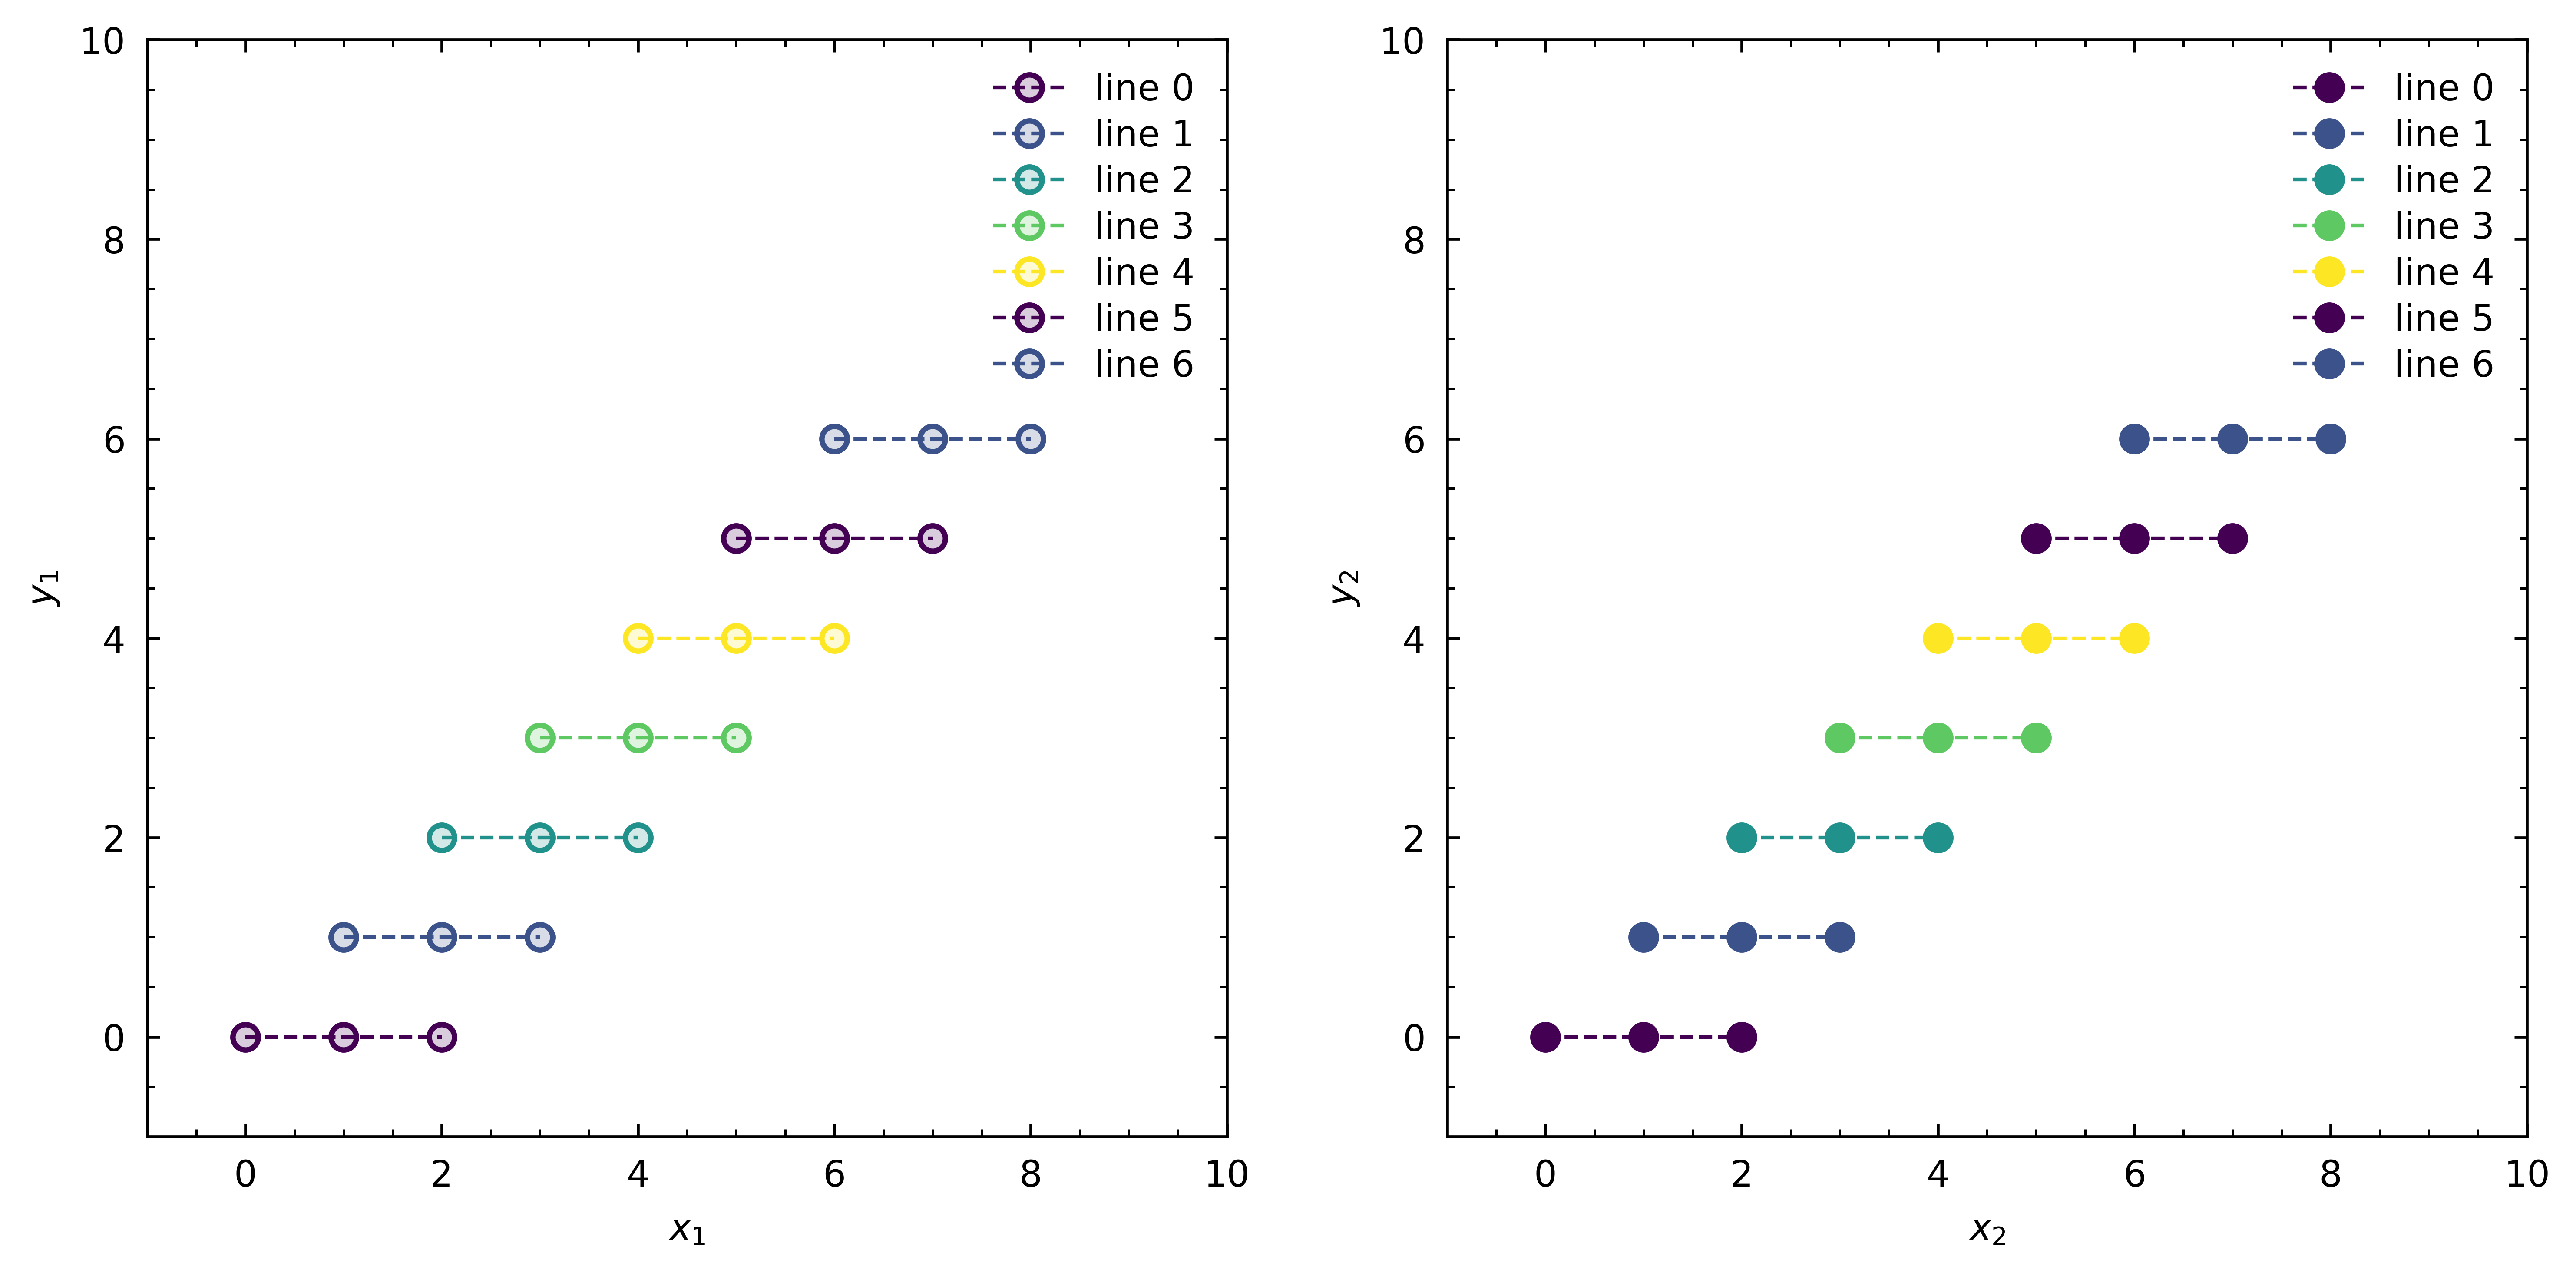
gsplot.line is a type of plot that displays information as a series of data points called ‘markers’ connected by straight lines. It is one of the most basic types of plots and is commonly used in data visualization.
gsplot.label adds labels, limits, and ticks to all axes of the plot. It is used to provide additional information on axes. Argument of gsplot.label is
[x_label, y_label, [xlim, *args], [ylim, *args]]. More details can be found in gsplot.label.
Example#
Main Functions#
Function |
A Brief Overview |
|---|---|
Add line plot to the axis specified by axis_target |
|
Add legend to all axes |
|
Add labels, limits, and ticks to all axes |
Code#
import gsplot as gs

axs = gs.axes(store=True, size=(10, 5), mosaic="AB")

for i in range(7):
    x = [i, i + 1, i + 2]
    y = [i, i, i]

    # Plot line by axis
    gs.line(axs[0], x, y, label=f"line {i}")

    # Fill the facecolor of the marker by alpha_mfc
    gs.line(axs[1], x, y, label=f"line {i}", alpha_mfc=1)

# Add legends to the all axes
gs.legend_axes()

# Add labels to the all axes
gs.label(
    [
        # ["xlabel", "ylabel", [xlim, *args], [ylim, *args]]
        ["$x_1$", "$y_1$", [-1, 10], [-1, 10]],
        ["$x_2$", "$y_2$", [-1, 10], [-1, 10]],
    ]
)

gs.show("line_and_label")
Plot#
