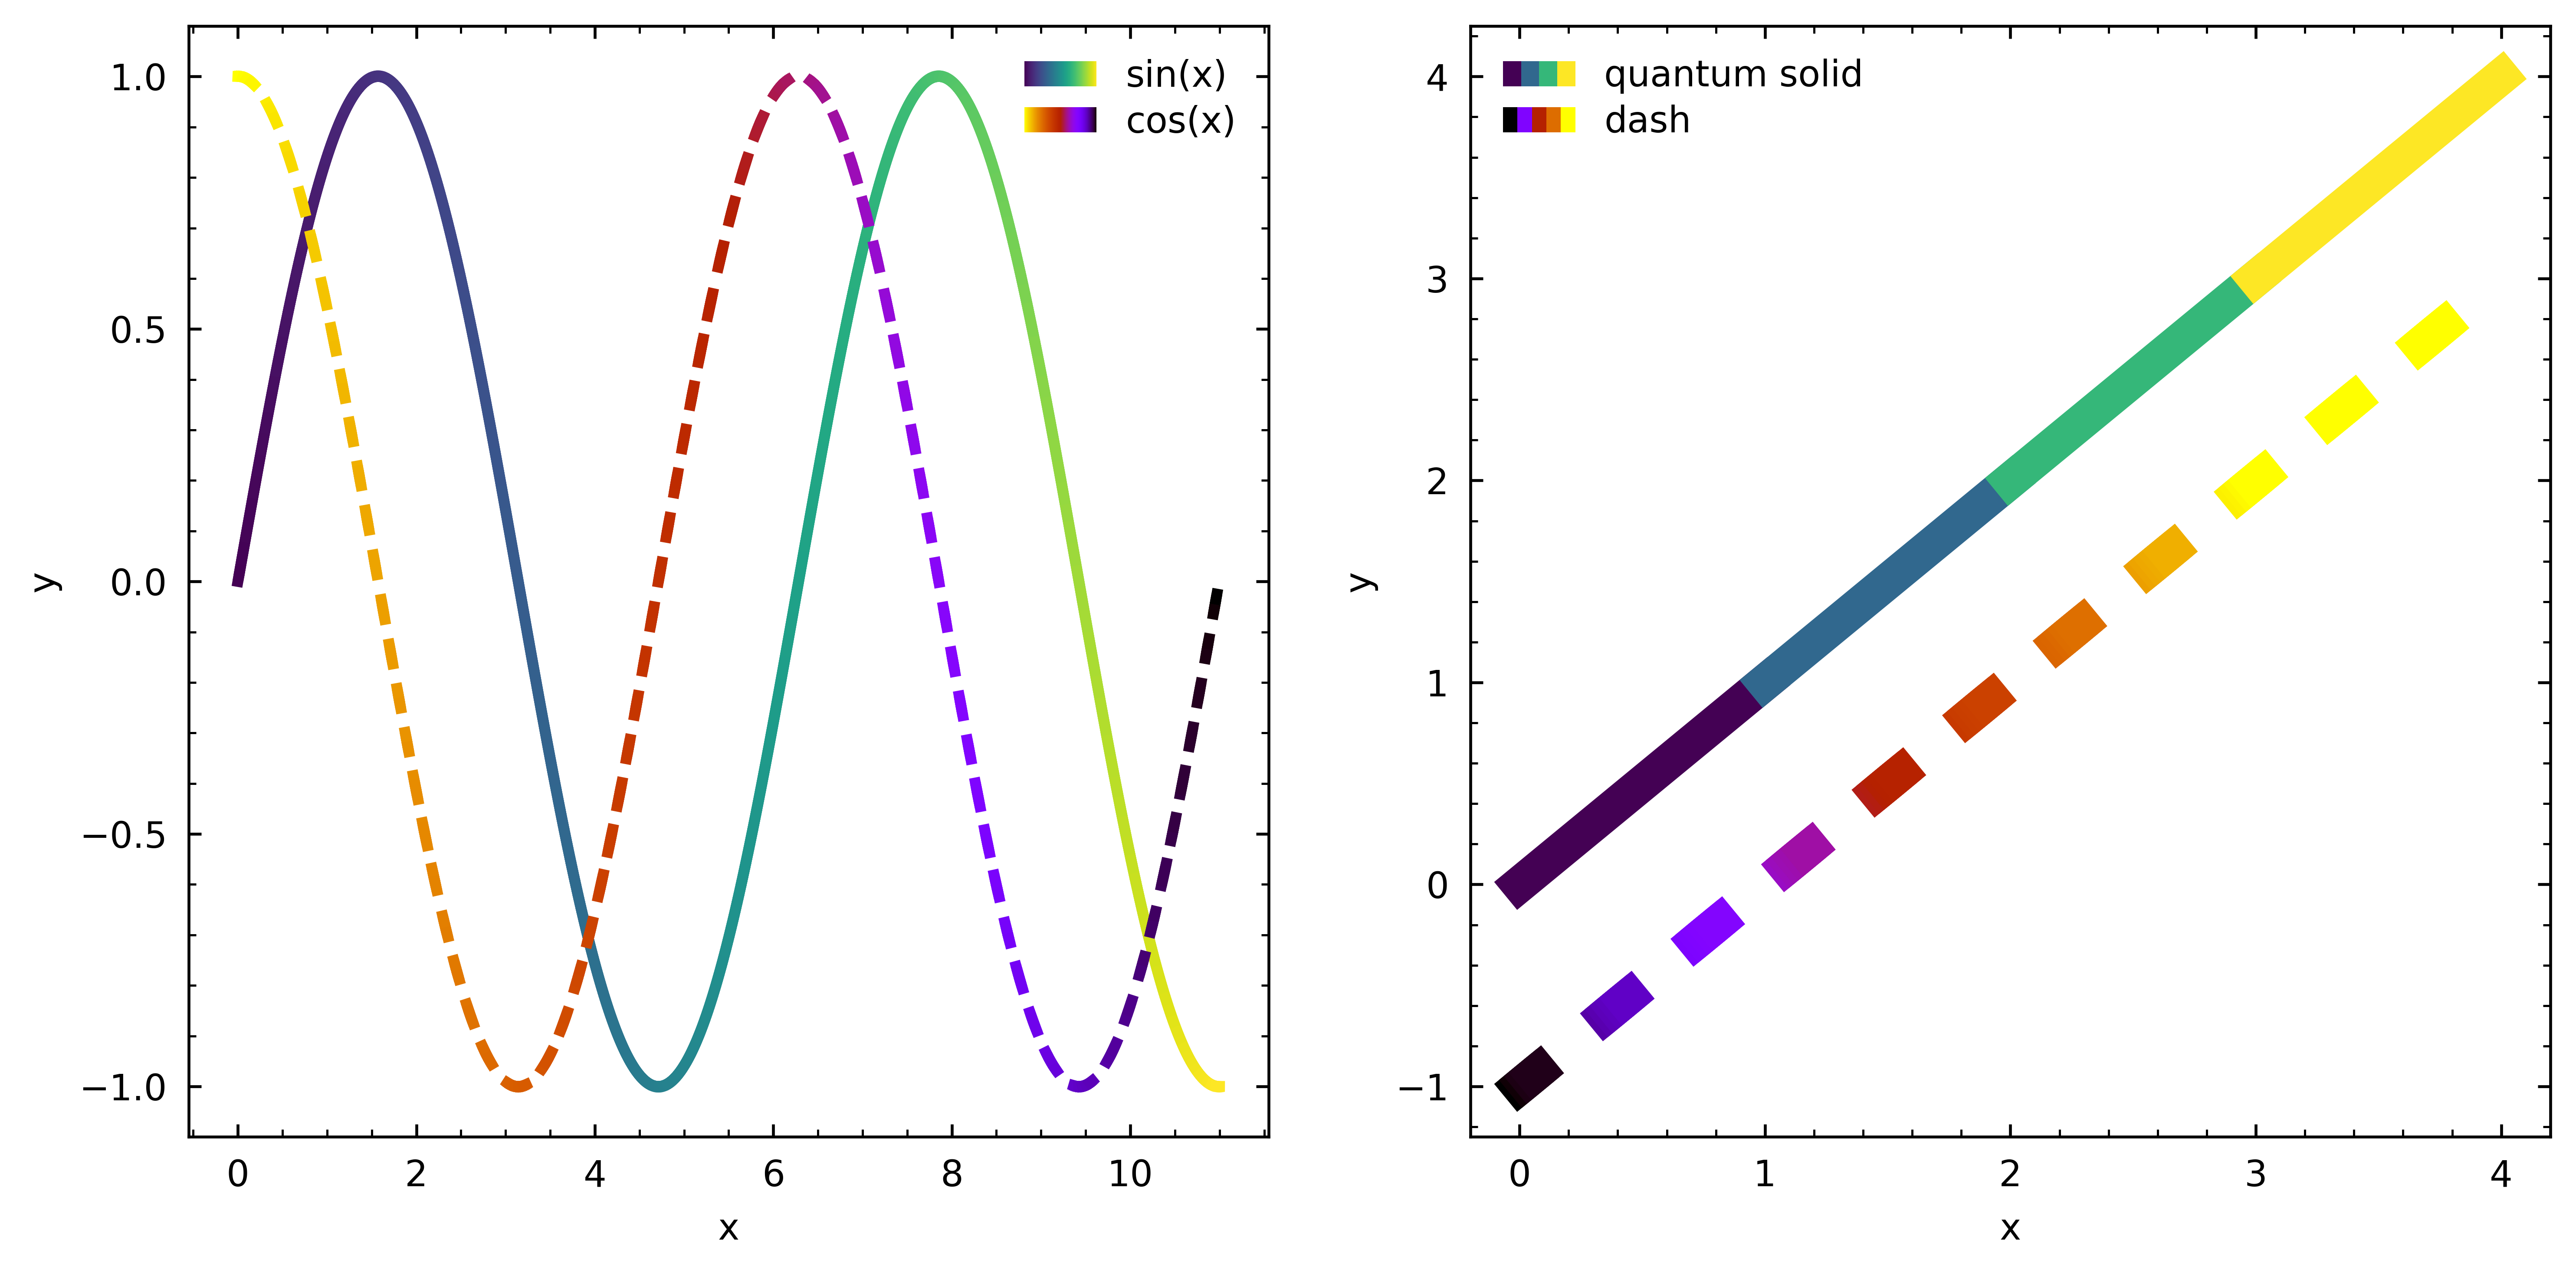
6. Line Colormap#
Example#
Main Functions#
Function |
A Brief Overview |
|---|---|
Add a solid line with colormap to the axis specified by axis_target |
|
Add a dashed line with colormap to the axis specified by axis_target |
|
Add legend with colormap to the axis specified by axis_target |
Code#
import numpy as np

import gsplot as gs

# Create data
x = np.linspace(0, 11, 1000)
u = np.sin(x)
v = np.cos(x)
t = np.sin(2 * x)

n = [0, 1, 2, 3, 4]
m = [0, 1, 0, 1, 0]
l = [-1, 0, 1, 2, 3]
axs = gs.axes(store=True, size=(10, 5), mosaic="AB")

# Line plot with solid colormap
gs.line_colormap_solid(axs[0], x, u, x, label="sin(x)", lw=3)
# Line plot with dashed colormap
gs.line_colormap_dashed(
    axs[0], x, v, x[::-1,], label="cos(x)", lw=3, cmap="gnuplot", reverse=True
)

# Line plot with solid colormap
gs.line_colormap_solid(axs[1], n, n, n, label="quantum solid", lw=10)
# Line plot with dashed colormap
gs.line_colormap_dashed(
    axs[1],
    n,
    l,
    n,
    label="dash",
    lw=10,
    line_pattern=(
        20,
        40,
    ),
    cmap="gnuplot",
)

gs.legend(axs[0])
gs.legend(axs[1], loc="upper left")

gs.label([["x", "y"], ["x", "y"]])

gs.show("line_colormap")
Plot#
