7. Graph White#
Example#
Main Functions#
Function |
A Brief Overview |
|---|---|
Set the facecolor of the figure |
|
Set the color of all axes to white |
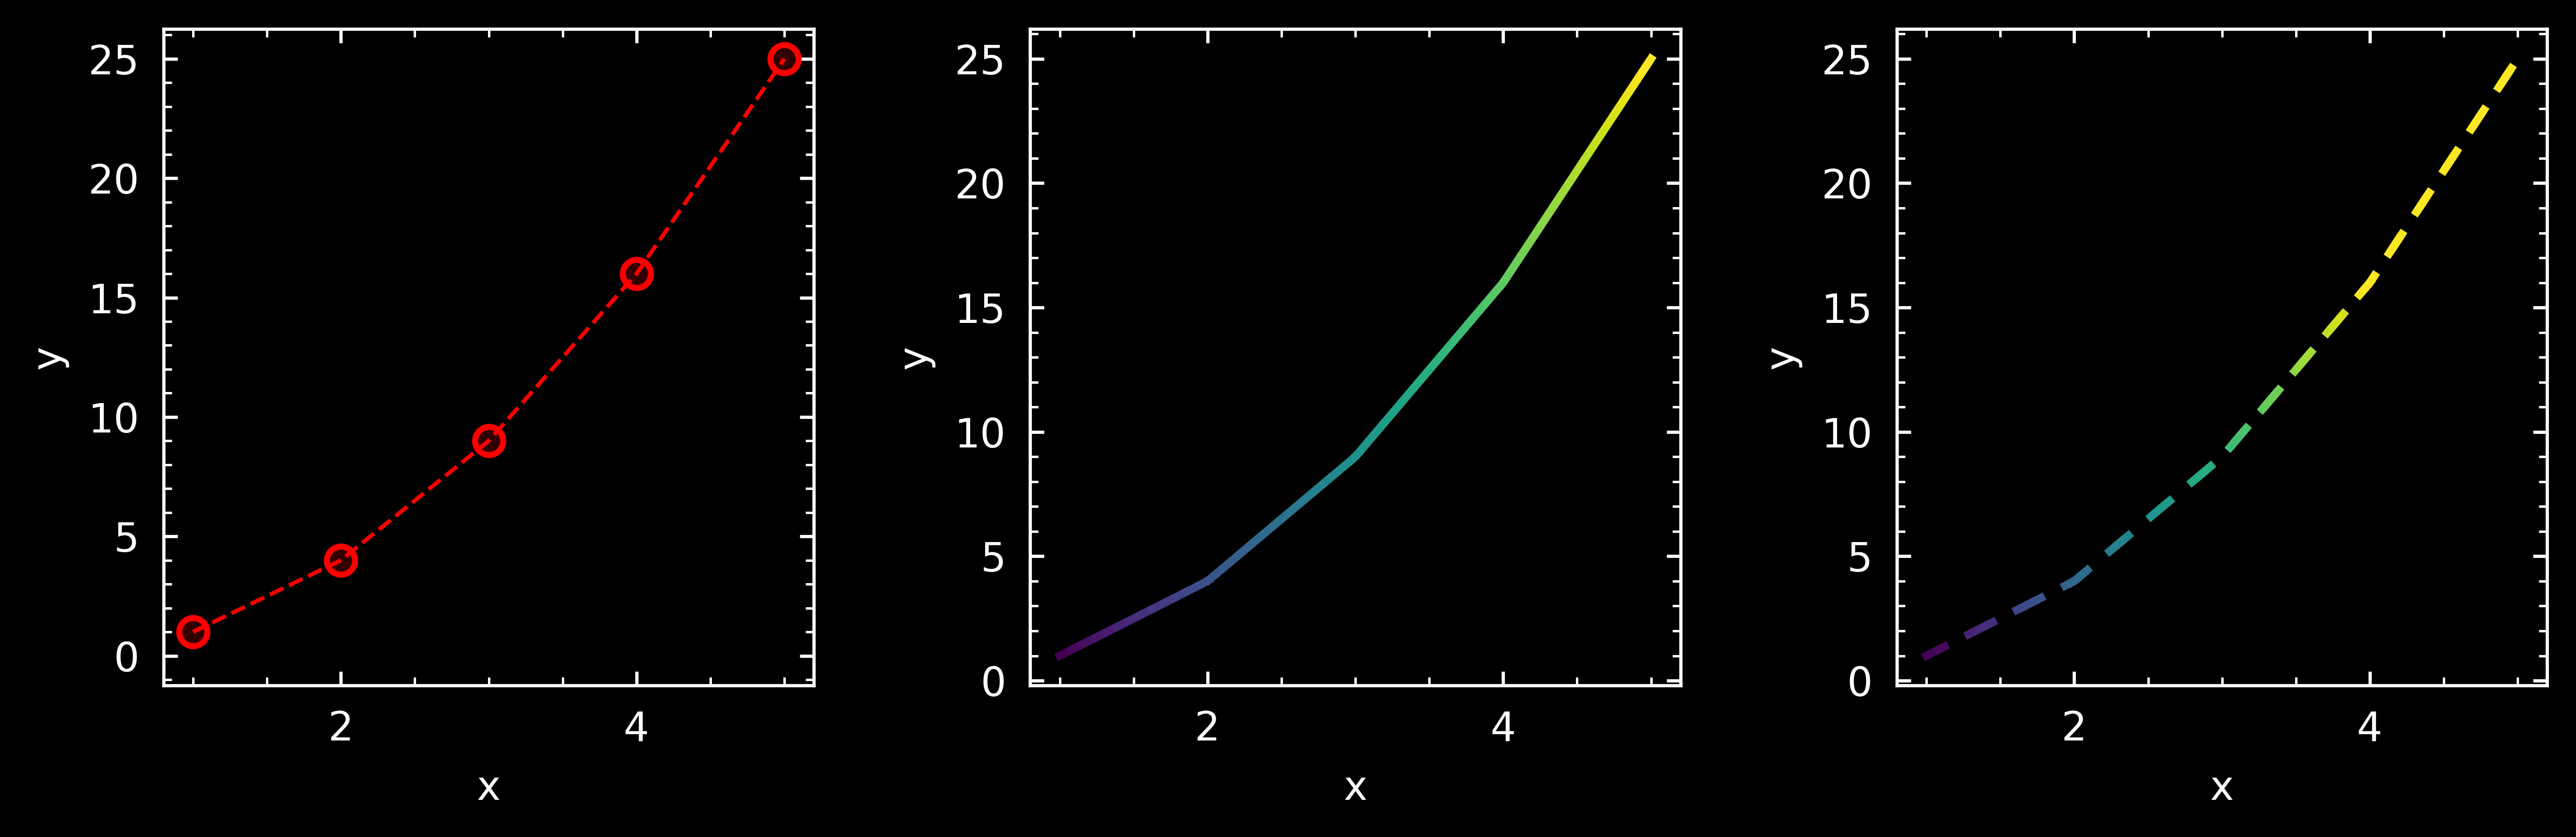
Code#
import gsplot as gs

# Set the facecolor of the graph to black
gs.graph_facecolor("black")

axs = gs.axes(store=True, size=(9, 3), mosaic="ABC")

x = [1, 2, 3, 4, 5]
y = [1, 4, 9, 16, 25]

gs.line(axs[0], x, y, color="red")
gs.line_colormap_solid(axs[1], x, y, x, lw=2, interpolation_points=100)
gs.line_colormap_dashed(axs[2], x, y, x, lw=2)

# Set the facecolor of axes to white
gs.graph_white_axes()

gs.label([["x", "y"], ["x", "y"], ["x", "y"]])

gs.show("graph_white")
Plot#