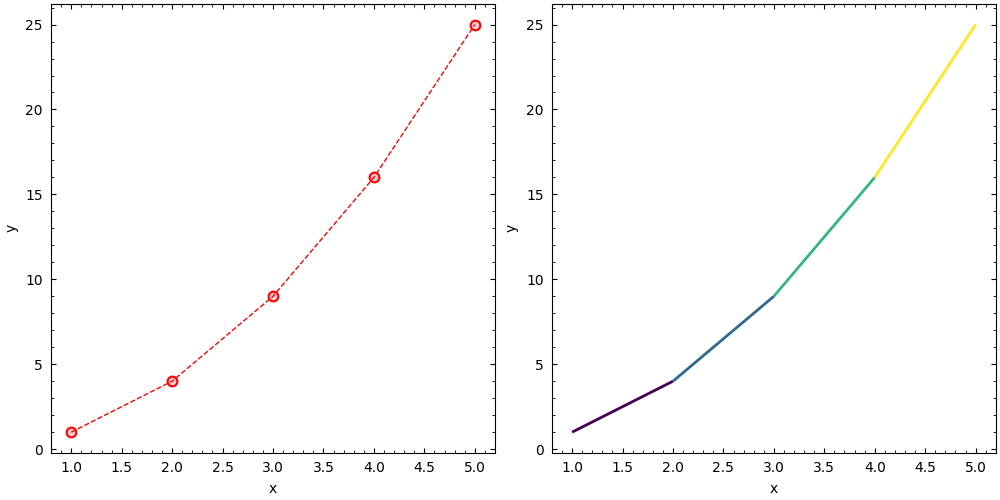
Transparent output#
Theme.transparent() is an explicit value that can be applied to one Figure
without changing unrelated Figures or global Matplotlib settings.
import gsplot as gs

fig, axes = gs.subplots("AB", size=(10, 5))
gs.set_theme(fig, gs.Theme.transparent())

x = [1, 2, 3, 4, 5]
y = [1, 4, 9, 16, 25]

gs.line(axes["A"], x, y, c="red")
gs.cmap_line(axes["B"], x, y, x, props={"linewidths": 2})
gs.label(axes, "x", "y")
gs.savefig(fig, "graph_transparent", show=False, overwrite=True)