Explicit layouts#
gsplot.subplots returns an explicit Figure and either an Axes, an array,
or a mosaic mapping. Each returned object is a native Matplotlib object.
Example#
The unit option accepts in, cm, mm, or pt and is converted to inches
before Matplotlib creates the Figure.
import gsplot as gs

# Create a Figure and an explicit mosaic mapping.
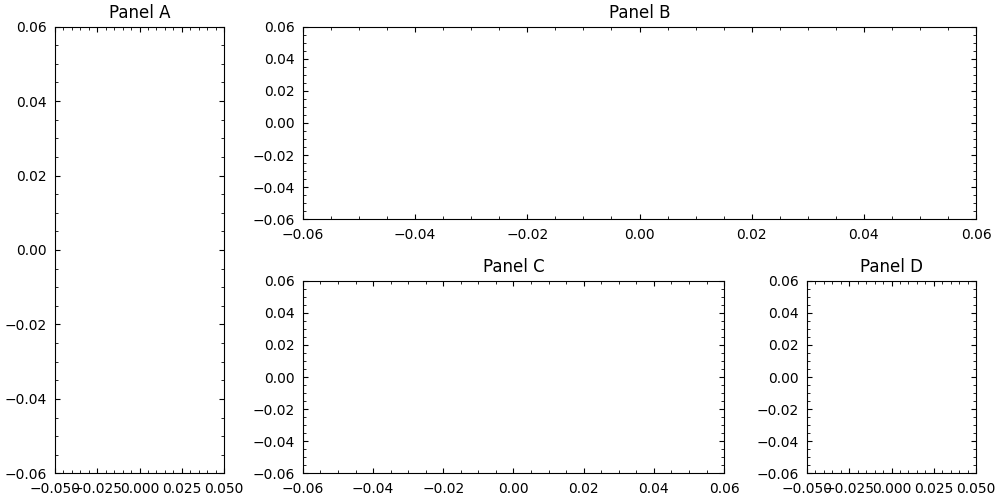
fig, axes = gs.subplots("ABBB;ACCD", size=(10, 5))
for name, axis in axes.items():
    gs.title(axis, f"Panel {name}")

# The output target and display policy are explicit.
gs.savefig(fig, "axes", show=False, overwrite=True)