
gsplot#
gsplot creates publication-quality scientific figures with a concise API on
top of Matplotlib. It provides paper-aware layouts,
plotting and styling helpers, validated immutable configuration, and opt-in
metadata writing while returning native Matplotlib objects.
Warning
gsplot is still beta software. APIs and defaults may change between releases. Please report reproducible bugs through the GitHub issue tracker.
Highlights#
create multi-panel figures with Matplotlib-compatible
Axesobjects;load explicit, immutable defaults from a schema-versioned
gsplot.json;add lines, scatter plots, legends, labels, ticks, and scientific styles;
save and display one explicitly owned Figure at a time.
Example#
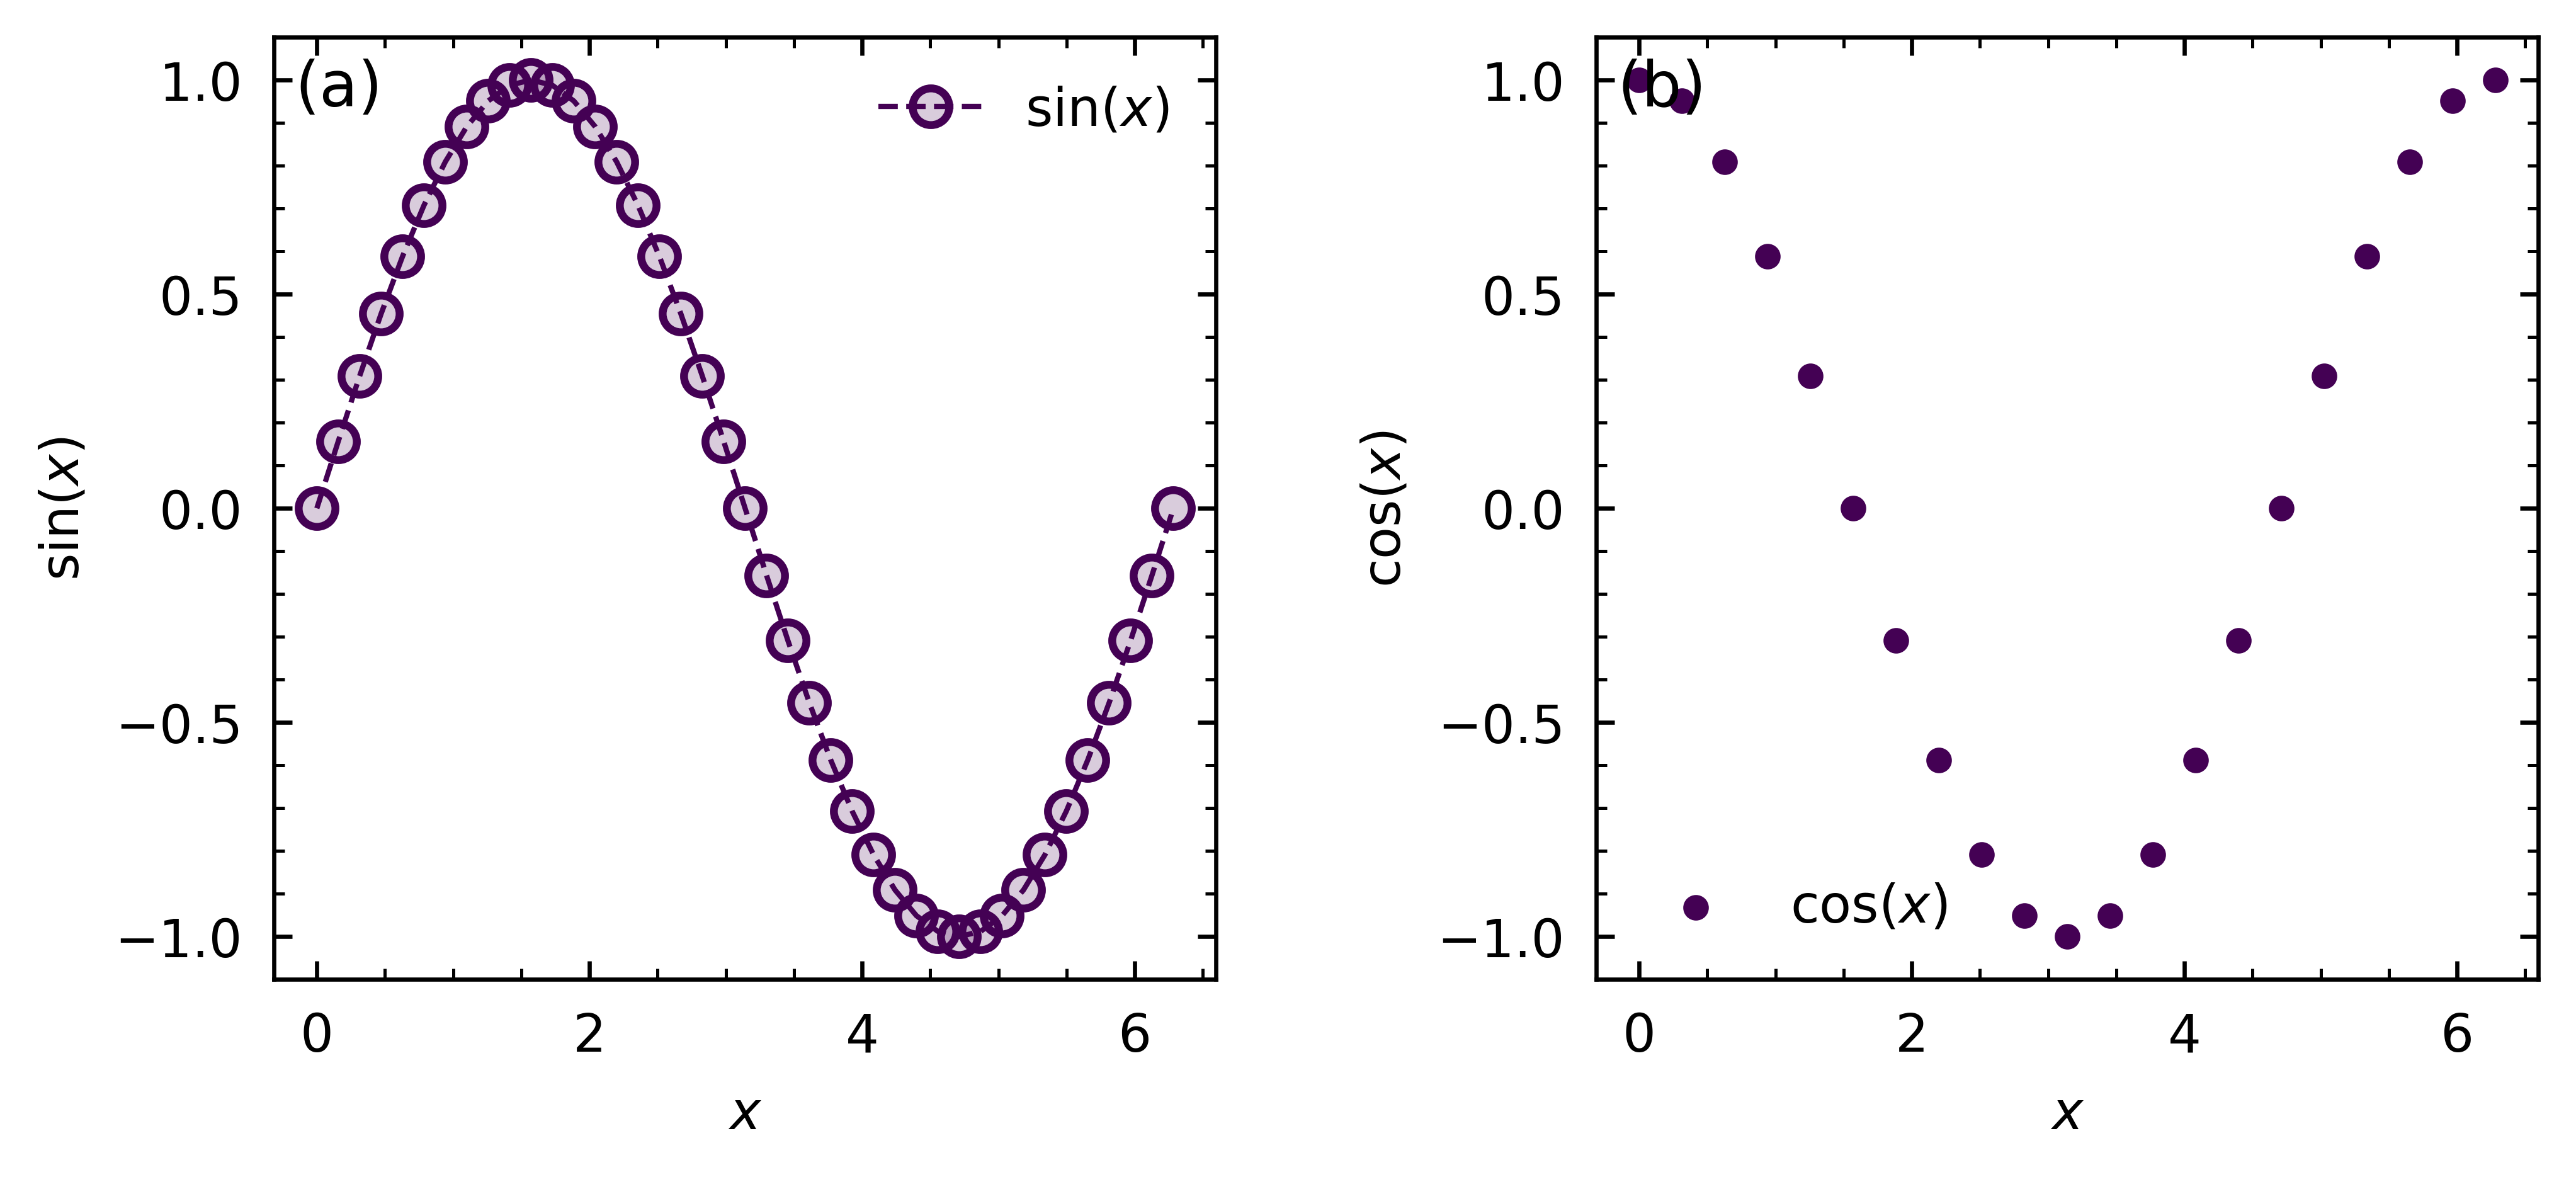
The documentation build executes the source below and displays the PNG generated by that same run.
import numpy as np

import gsplot as gs

x = np.linspace(0, 2 * np.pi, 41)
fig, ax = gs.subplots("AB", size=(7, 3))
gs.line(ax["A"], x, np.sin(x), label=r"$\sin(x)$")
gs.scatter(ax["B"], x[::2], np.cos(x[::2]), label=r"$\cos(x)$", s=15)
gs.label(
    ax,
    ((r"$x$", r"$\sin(x)$"), (r"$x$", r"$\cos(x)$")),
    square=True,
    index="in",
)
gs.legend(ax)
gs.save(fig, "line_and_label.png", show=False, close=True)
Start with Getting started, follow the publication guide, browse the examples, or use the API reference.